Immigrants from Germany vs Immigrants from Armenia College, Under 1 year
COMPARE
Immigrants from Germany
Immigrants from Armenia
College, Under 1 year
College, Under 1 year Comparison
Immigrants from Germany
Immigrants from Armenia
66.5%
COLLEGE, UNDER 1 YEAR
82.0/ 100
METRIC RATING
144th/ 347
METRIC RANK
64.7%
COLLEGE, UNDER 1 YEAR
28.1/ 100
METRIC RATING
191st/ 347
METRIC RANK
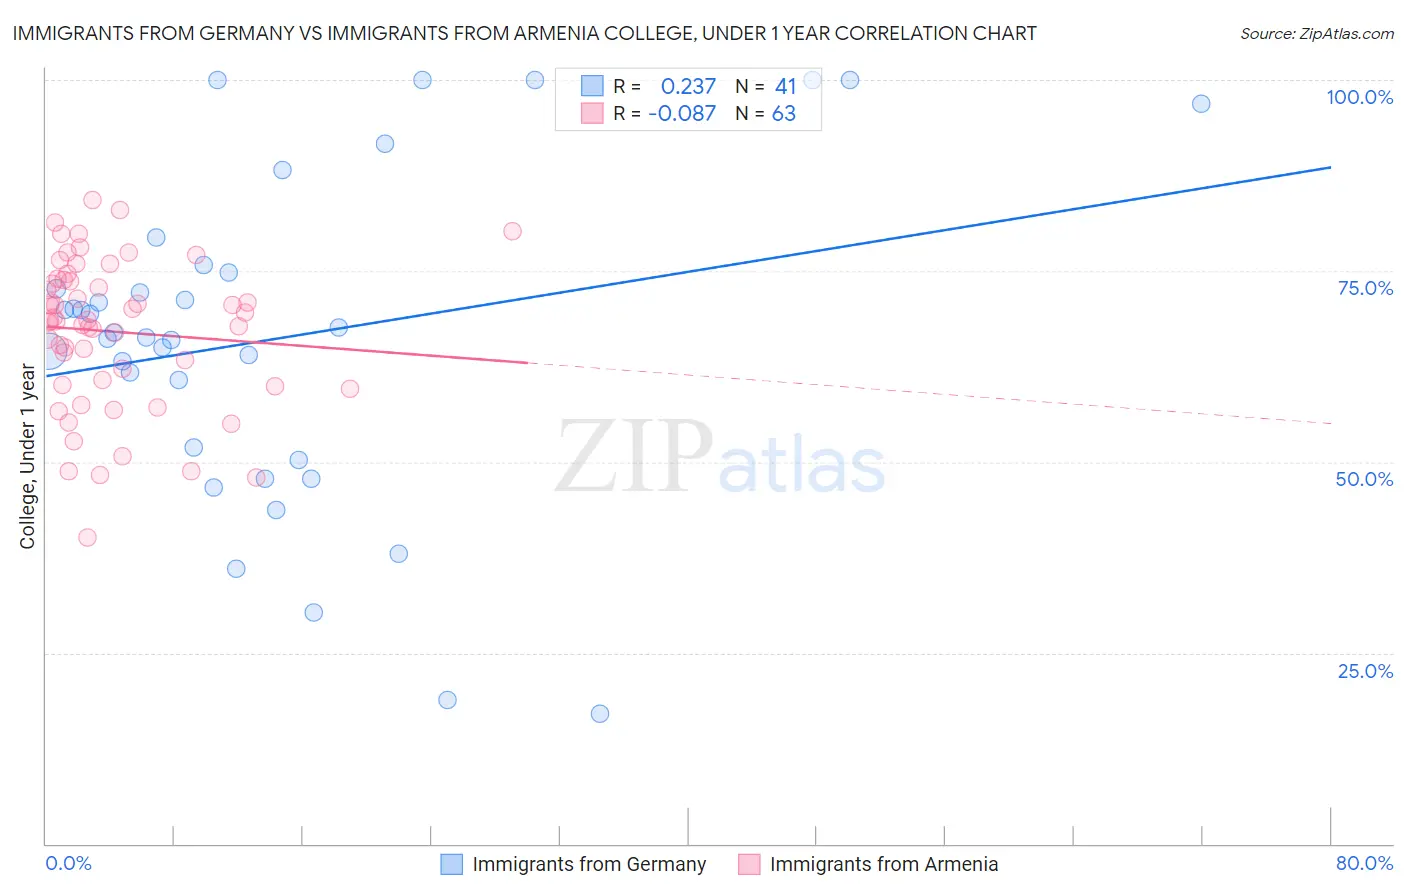
Immigrants from Germany vs Immigrants from Armenia College, Under 1 year Correlation Chart
The statistical analysis conducted on geographies consisting of 463,885,143 people shows a weak positive correlation between the proportion of Immigrants from Germany and percentage of population with at least college, under 1 year education in the United States with a correlation coefficient (R) of 0.237 and weighted average of 66.5%. Similarly, the statistical analysis conducted on geographies consisting of 97,725,183 people shows a slight negative correlation between the proportion of Immigrants from Armenia and percentage of population with at least college, under 1 year education in the United States with a correlation coefficient (R) of -0.087 and weighted average of 64.7%, a difference of 2.7%.
College, Under 1 year Correlation Summary
| Measurement | Immigrants from Germany | Immigrants from Armenia |
| Minimum | 17.0% | 40.2% |
| Maximum | 100.0% | 84.3% |
| Range | 83.0% | 44.1% |
| Mean | 66.2% | 67.0% |
| Median | 66.9% | 68.4% |
| Interquartile 25% (IQ1) | 51.1% | 60.1% |
| Interquartile 75% (IQ3) | 75.3% | 73.8% |
| Interquartile Range (IQR) | 24.2% | 13.6% |
| Standard Deviation (Sample) | 21.2% | 9.7% |
| Standard Deviation (Population) | 21.0% | 9.7% |
Similar Demographics by College, Under 1 year
Demographics Similar to Immigrants from Germany by College, Under 1 year
In terms of college, under 1 year, the demographic groups most similar to Immigrants from Germany are Immigrants from Kenya (66.5%, a difference of 0.010%), Kenyan (66.5%, a difference of 0.020%), Immigrants from Morocco (66.5%, a difference of 0.020%), Immigrants from Uganda (66.5%, a difference of 0.060%), and English (66.6%, a difference of 0.070%).
| Demographics | Rating | Rank | College, Under 1 year |
| Immigrants | Chile | 87.4 /100 | #137 | Excellent 66.8% |
| Immigrants | Italy | 86.9 /100 | #138 | Excellent 66.8% |
| Venezuelans | 85.9 /100 | #139 | Excellent 66.7% |
| Slavs | 85.9 /100 | #140 | Excellent 66.7% |
| Immigrants | Afghanistan | 85.1 /100 | #141 | Excellent 66.7% |
| English | 82.9 /100 | #142 | Excellent 66.6% |
| Immigrants | Uganda | 82.8 /100 | #143 | Excellent 66.5% |
| Immigrants | Germany | 82.0 /100 | #144 | Excellent 66.5% |
| Immigrants | Kenya | 81.8 /100 | #145 | Excellent 66.5% |
| Kenyans | 81.7 /100 | #146 | Excellent 66.5% |
| Immigrants | Morocco | 81.7 /100 | #147 | Excellent 66.5% |
| Taiwanese | 78.6 /100 | #148 | Good 66.4% |
| Immigrants | Venezuela | 77.9 /100 | #149 | Good 66.3% |
| Immigrants | Iraq | 77.1 /100 | #150 | Good 66.3% |
| Immigrants | Sudan | 76.0 /100 | #151 | Good 66.2% |
Demographics Similar to Immigrants from Armenia by College, Under 1 year
In terms of college, under 1 year, the demographic groups most similar to Immigrants from Armenia are Immigrants from Thailand (64.7%, a difference of 0.060%), Slovak (64.7%, a difference of 0.070%), Immigrants from Philippines (64.8%, a difference of 0.11%), Spanish (64.9%, a difference of 0.19%), and Immigrants from Cameroon (64.6%, a difference of 0.20%).
| Demographics | Rating | Rank | College, Under 1 year |
| Bermudans | 42.0 /100 | #184 | Average 65.2% |
| Sri Lankans | 41.7 /100 | #185 | Average 65.2% |
| Immigrants | Sierra Leone | 39.7 /100 | #186 | Fair 65.1% |
| Immigrants | Southern Europe | 34.3 /100 | #187 | Fair 64.9% |
| Immigrants | Albania | 32.0 /100 | #188 | Fair 64.9% |
| Spanish | 31.6 /100 | #189 | Fair 64.9% |
| Immigrants | Philippines | 30.1 /100 | #190 | Fair 64.8% |
| Immigrants | Armenia | 28.1 /100 | #191 | Fair 64.7% |
| Immigrants | Thailand | 27.0 /100 | #192 | Fair 64.7% |
| Slovaks | 26.7 /100 | #193 | Fair 64.7% |
| Immigrants | Cameroon | 24.6 /100 | #194 | Fair 64.6% |
| Immigrants | South Eastern Asia | 22.1 /100 | #195 | Fair 64.5% |
| Tongans | 21.2 /100 | #196 | Fair 64.5% |
| Costa Ricans | 19.6 /100 | #197 | Poor 64.4% |
| Tsimshian | 17.9 /100 | #198 | Poor 64.3% |