Immigrants from Africa vs Cajun Associate's Degree
COMPARE
Immigrants from Africa
Cajun
Associate's Degree
Associate's Degree Comparison
Immigrants from Africa
Cajuns
46.8%
ASSOCIATE'S DEGREE
63.2/ 100
METRIC RATING
162nd/ 347
METRIC RANK
37.4%
ASSOCIATE'S DEGREE
0.0/ 100
METRIC RATING
320th/ 347
METRIC RANK
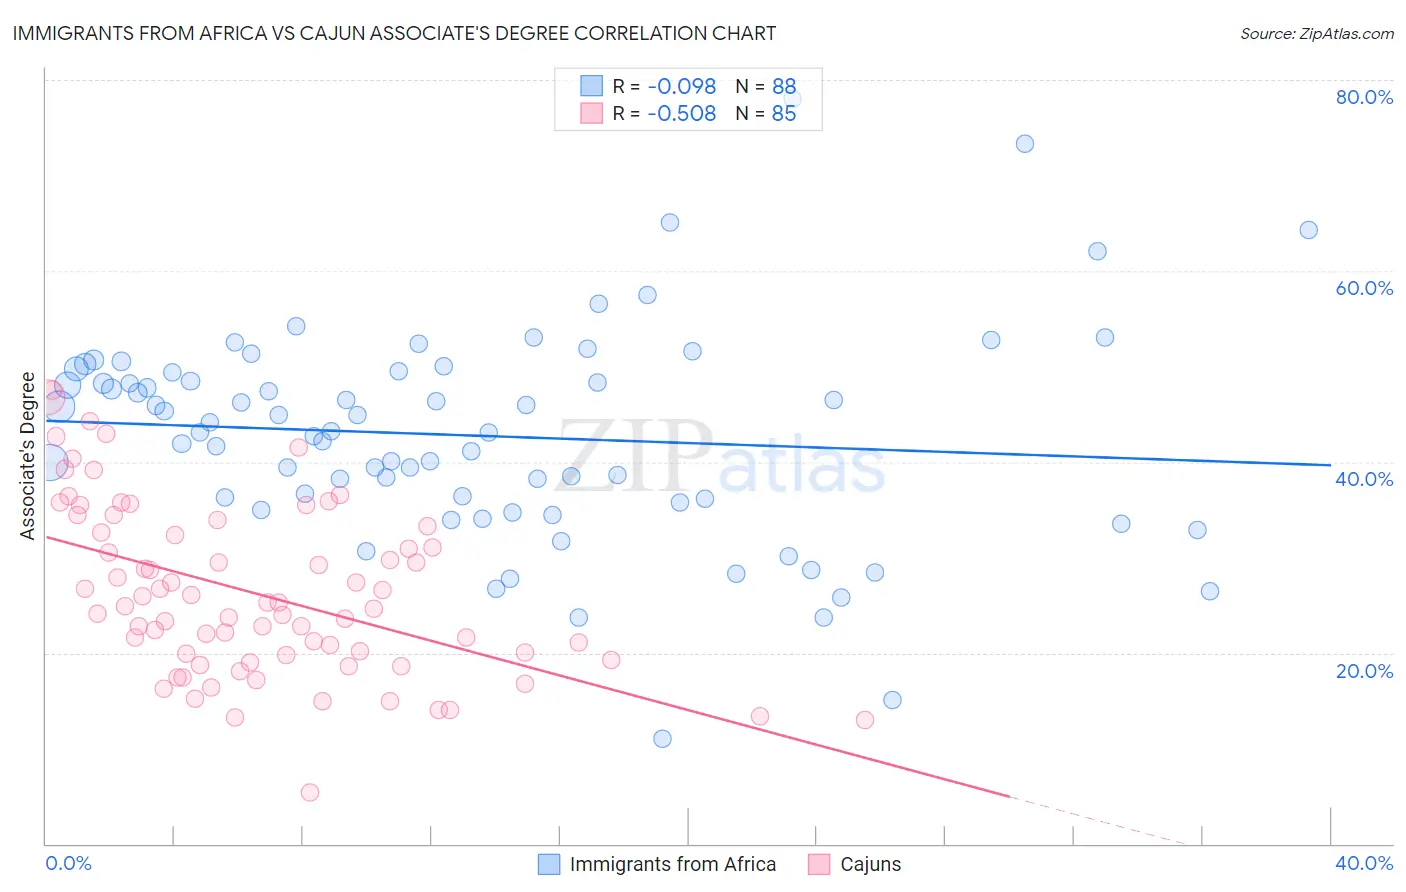
Immigrants from Africa vs Cajun Associate's Degree Correlation Chart
The statistical analysis conducted on geographies consisting of 469,405,809 people shows a slight negative correlation between the proportion of Immigrants from Africa and percentage of population with at least associate's degree education in the United States with a correlation coefficient (R) of -0.098 and weighted average of 46.8%. Similarly, the statistical analysis conducted on geographies consisting of 149,710,978 people shows a substantial negative correlation between the proportion of Cajuns and percentage of population with at least associate's degree education in the United States with a correlation coefficient (R) of -0.508 and weighted average of 37.4%, a difference of 25.3%.
Associate's Degree Correlation Summary
| Measurement | Immigrants from Africa | Cajun |
| Minimum | 11.0% | 5.4% |
| Maximum | 78.0% | 47.6% |
| Range | 67.0% | 42.2% |
| Mean | 42.7% | 26.2% |
| Median | 43.2% | 24.9% |
| Interquartile 25% (IQ1) | 35.9% | 19.5% |
| Interquartile 75% (IQ3) | 49.4% | 32.9% |
| Interquartile Range (IQR) | 13.5% | 13.4% |
| Standard Deviation (Sample) | 11.2% | 8.9% |
| Standard Deviation (Population) | 11.2% | 8.8% |
Similar Demographics by Associate's Degree
Demographics Similar to Immigrants from Africa by Associate's Degree
In terms of associate's degree, the demographic groups most similar to Immigrants from Africa are Somali (46.8%, a difference of 0.060%), Colombian (46.8%, a difference of 0.060%), Scandinavian (46.9%, a difference of 0.16%), Scottish (46.9%, a difference of 0.18%), and Immigrants from South America (46.7%, a difference of 0.26%).
| Demographics | Rating | Rank | Associate's Degree |
| Kenyans | 70.6 /100 | #155 | Good 47.1% |
| South Americans | 70.5 /100 | #156 | Good 47.1% |
| Sudanese | 70.3 /100 | #157 | Good 47.1% |
| Immigrants | Germany | 69.7 /100 | #158 | Good 47.1% |
| Immigrants | Poland | 69.2 /100 | #159 | Good 47.1% |
| Scottish | 65.4 /100 | #160 | Good 46.9% |
| Scandinavians | 65.2 /100 | #161 | Good 46.9% |
| Immigrants | Africa | 63.2 /100 | #162 | Good 46.8% |
| Somalis | 62.5 /100 | #163 | Good 46.8% |
| Colombians | 62.4 /100 | #164 | Good 46.8% |
| Immigrants | South America | 59.9 /100 | #165 | Average 46.7% |
| Hungarians | 59.3 /100 | #166 | Average 46.7% |
| Immigrants | Sierra Leone | 59.2 /100 | #167 | Average 46.7% |
| Immigrants | Somalia | 55.5 /100 | #168 | Average 46.5% |
| Uruguayans | 55.4 /100 | #169 | Average 46.5% |
Demographics Similar to Cajuns by Associate's Degree
In terms of associate's degree, the demographic groups most similar to Cajuns are Fijian (37.4%, a difference of 0.030%), Immigrants from Yemen (37.3%, a difference of 0.12%), Alaska Native (37.5%, a difference of 0.25%), Pennsylvania German (37.2%, a difference of 0.40%), and Yaqui (37.6%, a difference of 0.48%).
| Demographics | Rating | Rank | Associate's Degree |
| Hispanics or Latinos | 0.0 /100 | #313 | Tragic 37.7% |
| Seminole | 0.0 /100 | #314 | Tragic 37.7% |
| Creek | 0.0 /100 | #315 | Tragic 37.6% |
| Crow | 0.0 /100 | #316 | Tragic 37.6% |
| Yaqui | 0.0 /100 | #317 | Tragic 37.6% |
| Alaska Natives | 0.0 /100 | #318 | Tragic 37.5% |
| Fijians | 0.0 /100 | #319 | Tragic 37.4% |
| Cajuns | 0.0 /100 | #320 | Tragic 37.4% |
| Immigrants | Yemen | 0.0 /100 | #321 | Tragic 37.3% |
| Pennsylvania Germans | 0.0 /100 | #322 | Tragic 37.2% |
| Immigrants | Cabo Verde | 0.0 /100 | #323 | Tragic 36.8% |
| Arapaho | 0.0 /100 | #324 | Tragic 36.7% |
| Menominee | 0.0 /100 | #325 | Tragic 36.7% |
| Kiowa | 0.0 /100 | #326 | Tragic 36.5% |
| Dutch West Indians | 0.0 /100 | #327 | Tragic 36.5% |