Immigrants from Africa vs Carpatho Rusyn Associate's Degree
COMPARE
Immigrants from Africa
Carpatho Rusyn
Associate's Degree
Associate's Degree Comparison
Immigrants from Africa
Carpatho Rusyns
46.8%
ASSOCIATE'S DEGREE
63.2/ 100
METRIC RATING
162nd/ 347
METRIC RANK
50.6%
ASSOCIATE'S DEGREE
99.3/ 100
METRIC RATING
73rd/ 347
METRIC RANK
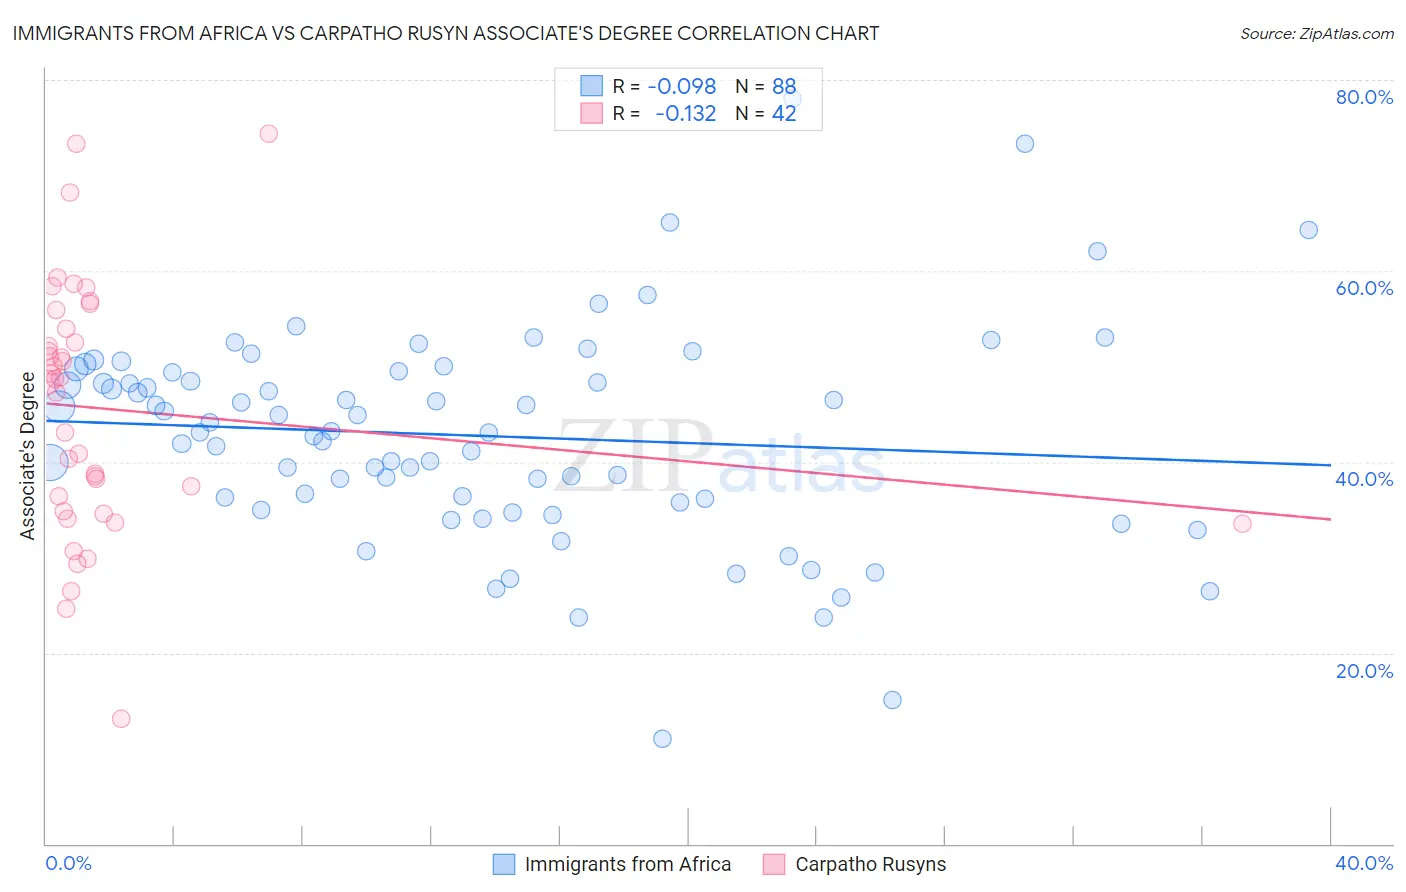
Immigrants from Africa vs Carpatho Rusyn Associate's Degree Correlation Chart
The statistical analysis conducted on geographies consisting of 469,405,809 people shows a slight negative correlation between the proportion of Immigrants from Africa and percentage of population with at least associate's degree education in the United States with a correlation coefficient (R) of -0.098 and weighted average of 46.8%. Similarly, the statistical analysis conducted on geographies consisting of 58,871,690 people shows a poor negative correlation between the proportion of Carpatho Rusyns and percentage of population with at least associate's degree education in the United States with a correlation coefficient (R) of -0.132 and weighted average of 50.6%, a difference of 8.2%.
Associate's Degree Correlation Summary
| Measurement | Immigrants from Africa | Carpatho Rusyn |
| Minimum | 11.0% | 13.2% |
| Maximum | 78.0% | 74.4% |
| Range | 67.0% | 61.2% |
| Mean | 42.7% | 45.6% |
| Median | 43.2% | 48.5% |
| Interquartile 25% (IQ1) | 35.9% | 34.9% |
| Interquartile 75% (IQ3) | 49.4% | 53.9% |
| Interquartile Range (IQR) | 13.5% | 19.0% |
| Standard Deviation (Sample) | 11.2% | 13.2% |
| Standard Deviation (Population) | 11.2% | 13.0% |
Similar Demographics by Associate's Degree
Demographics Similar to Immigrants from Africa by Associate's Degree
In terms of associate's degree, the demographic groups most similar to Immigrants from Africa are Somali (46.8%, a difference of 0.060%), Colombian (46.8%, a difference of 0.060%), Scandinavian (46.9%, a difference of 0.16%), Scottish (46.9%, a difference of 0.18%), and Immigrants from South America (46.7%, a difference of 0.26%).
| Demographics | Rating | Rank | Associate's Degree |
| Kenyans | 70.6 /100 | #155 | Good 47.1% |
| South Americans | 70.5 /100 | #156 | Good 47.1% |
| Sudanese | 70.3 /100 | #157 | Good 47.1% |
| Immigrants | Germany | 69.7 /100 | #158 | Good 47.1% |
| Immigrants | Poland | 69.2 /100 | #159 | Good 47.1% |
| Scottish | 65.4 /100 | #160 | Good 46.9% |
| Scandinavians | 65.2 /100 | #161 | Good 46.9% |
| Immigrants | Africa | 63.2 /100 | #162 | Good 46.8% |
| Somalis | 62.5 /100 | #163 | Good 46.8% |
| Colombians | 62.4 /100 | #164 | Good 46.8% |
| Immigrants | South America | 59.9 /100 | #165 | Average 46.7% |
| Hungarians | 59.3 /100 | #166 | Average 46.7% |
| Immigrants | Sierra Leone | 59.2 /100 | #167 | Average 46.7% |
| Immigrants | Somalia | 55.5 /100 | #168 | Average 46.5% |
| Uruguayans | 55.4 /100 | #169 | Average 46.5% |
Demographics Similar to Carpatho Rusyns by Associate's Degree
In terms of associate's degree, the demographic groups most similar to Carpatho Rusyns are Lithuanian (50.6%, a difference of 0.060%), Immigrants from Scotland (50.6%, a difference of 0.10%), Immigrants from Zimbabwe (50.5%, a difference of 0.31%), Immigrants from Lebanon (50.5%, a difference of 0.34%), and Immigrants from Eastern Europe (50.5%, a difference of 0.38%).
| Demographics | Rating | Rank | Associate's Degree |
| Immigrants | Europe | 99.7 /100 | #66 | Exceptional 51.3% |
| Argentineans | 99.6 /100 | #67 | Exceptional 51.2% |
| Immigrants | Indonesia | 99.5 /100 | #68 | Exceptional 51.0% |
| Egyptians | 99.5 /100 | #69 | Exceptional 50.9% |
| Immigrants | Argentina | 99.5 /100 | #70 | Exceptional 50.9% |
| Immigrants | Romania | 99.5 /100 | #71 | Exceptional 50.9% |
| Immigrants | Pakistan | 99.5 /100 | #72 | Exceptional 50.9% |
| Carpatho Rusyns | 99.3 /100 | #73 | Exceptional 50.6% |
| Lithuanians | 99.3 /100 | #74 | Exceptional 50.6% |
| Immigrants | Scotland | 99.3 /100 | #75 | Exceptional 50.6% |
| Immigrants | Zimbabwe | 99.2 /100 | #76 | Exceptional 50.5% |
| Immigrants | Lebanon | 99.1 /100 | #77 | Exceptional 50.5% |
| Immigrants | Eastern Europe | 99.1 /100 | #78 | Exceptional 50.5% |
| Ethiopians | 99.1 /100 | #79 | Exceptional 50.4% |
| Armenians | 99.1 /100 | #80 | Exceptional 50.4% |