Immigrants from Afghanistan vs Shoshone Single Mother Poverty
COMPARE
Immigrants from Afghanistan
Shoshone
Single Mother Poverty
Single Mother Poverty Comparison
Immigrants from Afghanistan
Shoshone
28.3%
SINGLE MOTHER POVERTY
92.1/ 100
METRIC RATING
121st/ 347
METRIC RANK
32.9%
SINGLE MOTHER POVERTY
0.0/ 100
METRIC RATING
292nd/ 347
METRIC RANK
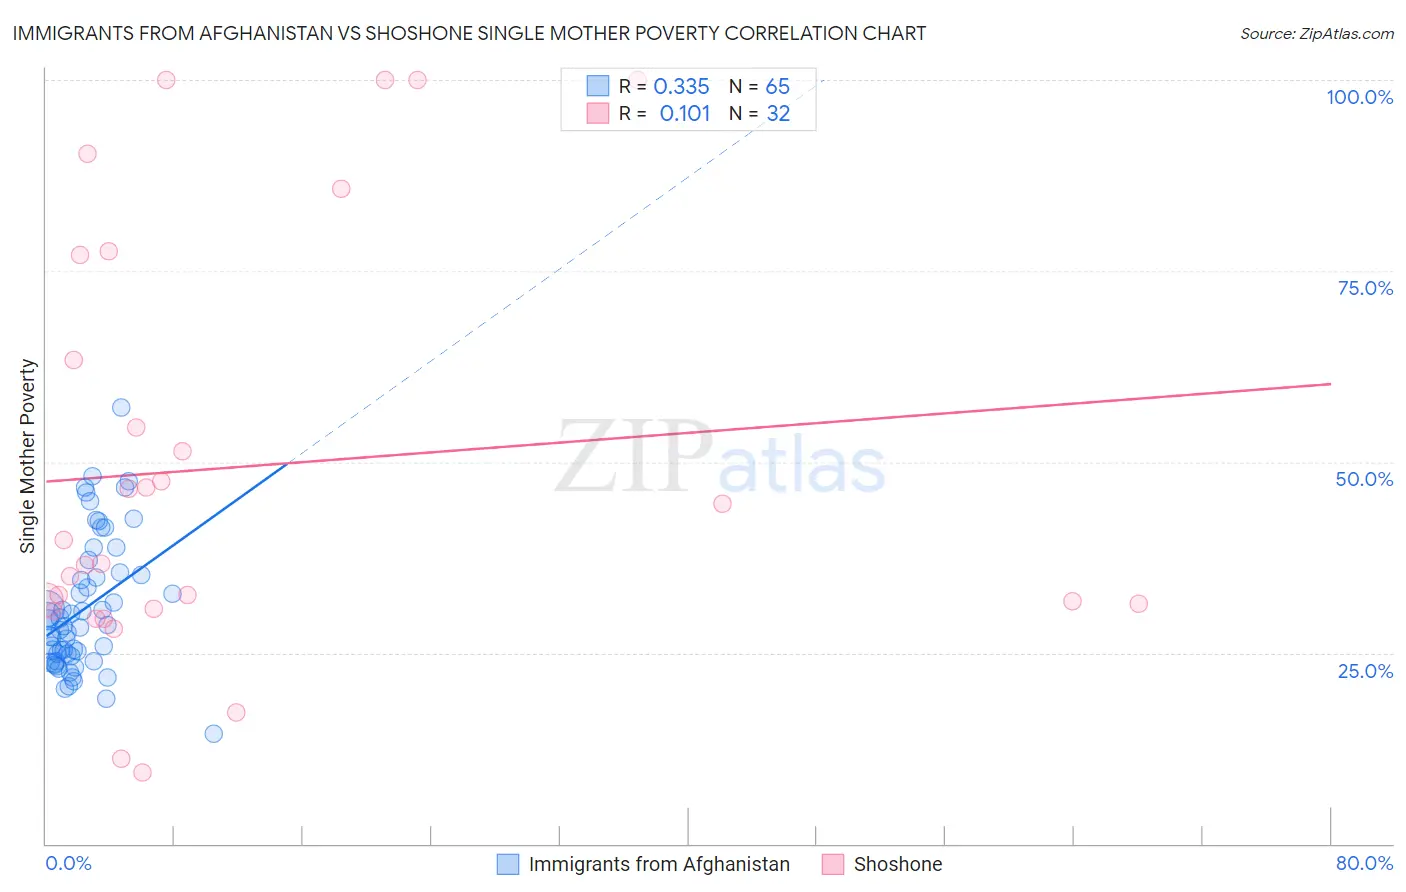
Immigrants from Afghanistan vs Shoshone Single Mother Poverty Correlation Chart
The statistical analysis conducted on geographies consisting of 145,984,259 people shows a mild positive correlation between the proportion of Immigrants from Afghanistan and poverty level among single mothers in the United States with a correlation coefficient (R) of 0.335 and weighted average of 28.3%. Similarly, the statistical analysis conducted on geographies consisting of 66,288,381 people shows a poor positive correlation between the proportion of Shoshone and poverty level among single mothers in the United States with a correlation coefficient (R) of 0.101 and weighted average of 32.9%, a difference of 16.2%.
Single Mother Poverty Correlation Summary
| Measurement | Immigrants from Afghanistan | Shoshone |
| Minimum | 14.5% | 9.3% |
| Maximum | 57.2% | 100.0% |
| Range | 42.7% | 90.7% |
| Mean | 30.7% | 49.3% |
| Median | 28.4% | 38.2% |
| Interquartile 25% (IQ1) | 24.2% | 31.1% |
| Interquartile 75% (IQ3) | 35.4% | 70.2% |
| Interquartile Range (IQR) | 11.1% | 39.1% |
| Standard Deviation (Sample) | 8.7% | 27.4% |
| Standard Deviation (Population) | 8.6% | 27.0% |
Similar Demographics by Single Mother Poverty
Demographics Similar to Immigrants from Afghanistan by Single Mother Poverty
In terms of single mother poverty, the demographic groups most similar to Immigrants from Afghanistan are Cypriot (28.3%, a difference of 0.040%), Immigrants from Syria (28.3%, a difference of 0.050%), Colombian (28.3%, a difference of 0.050%), Uruguayan (28.3%, a difference of 0.060%), and Immigrants from Switzerland (28.3%, a difference of 0.060%).
| Demographics | Rating | Rank | Single Mother Poverty |
| Immigrants | Western Asia | 92.7 /100 | #114 | Exceptional 28.3% |
| Immigrants | Kuwait | 92.7 /100 | #115 | Exceptional 28.3% |
| Immigrants | Uganda | 92.5 /100 | #116 | Exceptional 28.3% |
| Australians | 92.5 /100 | #117 | Exceptional 28.3% |
| Brazilians | 92.4 /100 | #118 | Exceptional 28.3% |
| Immigrants | Syria | 92.4 /100 | #119 | Exceptional 28.3% |
| Cypriots | 92.3 /100 | #120 | Exceptional 28.3% |
| Immigrants | Afghanistan | 92.1 /100 | #121 | Exceptional 28.3% |
| Colombians | 91.8 /100 | #122 | Exceptional 28.3% |
| Uruguayans | 91.7 /100 | #123 | Exceptional 28.3% |
| Immigrants | Switzerland | 91.7 /100 | #124 | Exceptional 28.3% |
| Kenyans | 90.9 /100 | #125 | Exceptional 28.4% |
| Immigrants | Chile | 90.8 /100 | #126 | Exceptional 28.4% |
| Poles | 90.8 /100 | #127 | Exceptional 28.4% |
| Immigrants | England | 90.5 /100 | #128 | Exceptional 28.4% |
Demographics Similar to Shoshone by Single Mother Poverty
In terms of single mother poverty, the demographic groups most similar to Shoshone are Guatemalan (32.9%, a difference of 0.020%), Aleut (32.9%, a difference of 0.030%), French American Indian (33.1%, a difference of 0.66%), Yaqui (33.1%, a difference of 0.69%), and Blackfeet (33.2%, a difference of 0.85%).
| Demographics | Rating | Rank | Single Mother Poverty |
| Immigrants | Latin America | 0.0 /100 | #285 | Tragic 32.4% |
| Yup'ik | 0.0 /100 | #286 | Tragic 32.5% |
| Immigrants | Dominica | 0.0 /100 | #287 | Tragic 32.5% |
| Somalis | 0.0 /100 | #288 | Tragic 32.6% |
| U.S. Virgin Islanders | 0.0 /100 | #289 | Tragic 32.6% |
| Osage | 0.0 /100 | #290 | Tragic 32.6% |
| Guatemalans | 0.0 /100 | #291 | Tragic 32.9% |
| Shoshone | 0.0 /100 | #292 | Tragic 32.9% |
| Aleuts | 0.0 /100 | #293 | Tragic 32.9% |
| French American Indians | 0.0 /100 | #294 | Tragic 33.1% |
| Yaqui | 0.0 /100 | #295 | Tragic 33.1% |
| Blackfeet | 0.0 /100 | #296 | Tragic 33.2% |
| Pennsylvania Germans | 0.0 /100 | #297 | Tragic 33.2% |
| Africans | 0.0 /100 | #298 | Tragic 33.3% |
| Immigrants | Guatemala | 0.0 /100 | #299 | Tragic 33.3% |