Immigrants from Syria vs Macedonian Master's Degree
COMPARE
Immigrants from Syria
Macedonian
Master's Degree
Master's Degree Comparison
Immigrants from Syria
Macedonians
16.2%
MASTER'S DEGREE
93.3/ 100
METRIC RATING
129th/ 347
METRIC RANK
16.7%
MASTER'S DEGREE
97.7/ 100
METRIC RATING
112th/ 347
METRIC RANK
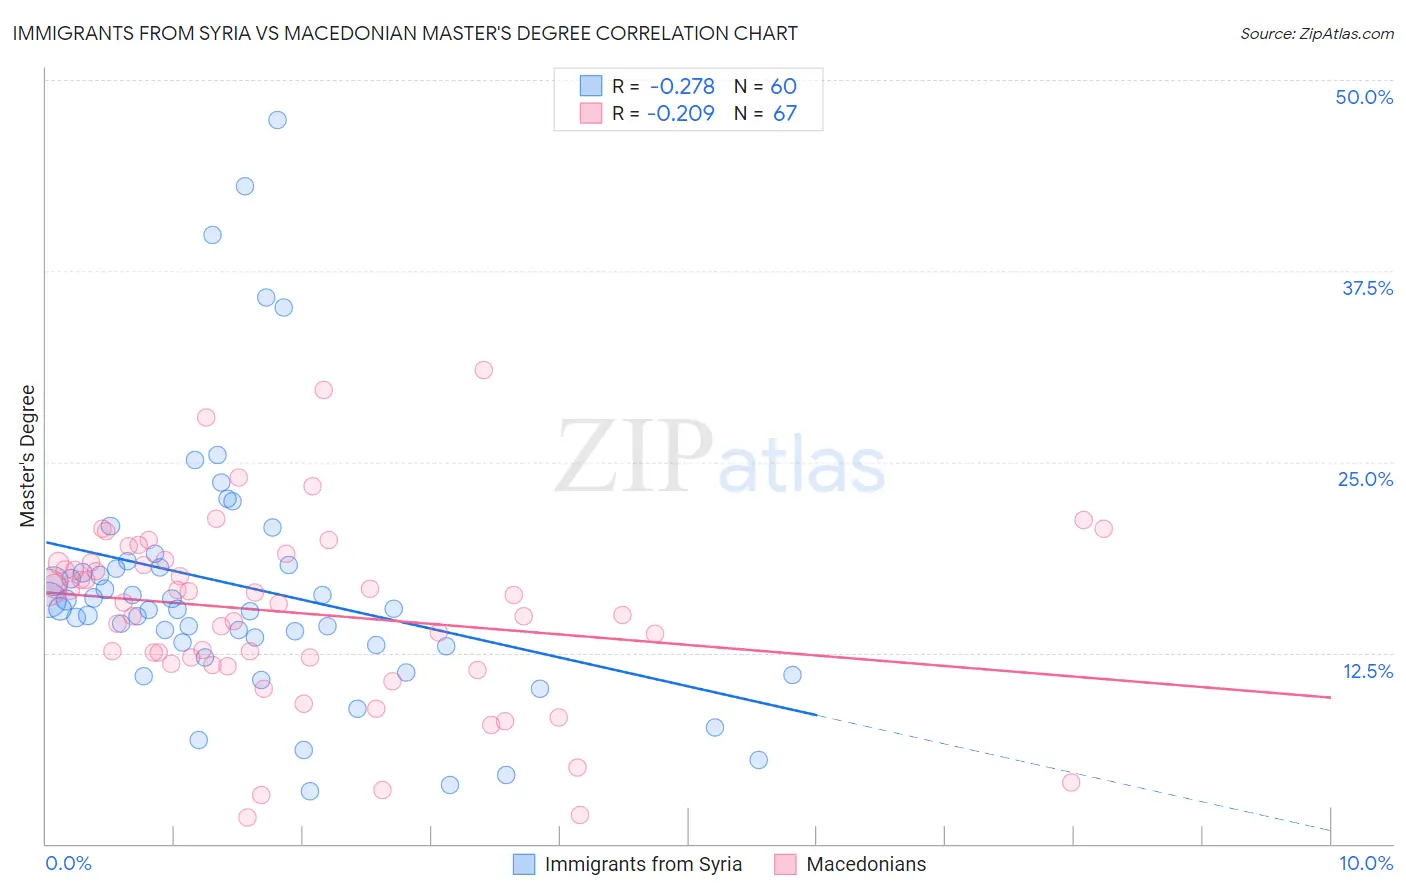
Immigrants from Syria vs Macedonian Master's Degree Correlation Chart
The statistical analysis conducted on geographies consisting of 174,107,928 people shows a weak negative correlation between the proportion of Immigrants from Syria and percentage of population with at least master's degree education in the United States with a correlation coefficient (R) of -0.278 and weighted average of 16.2%. Similarly, the statistical analysis conducted on geographies consisting of 132,580,615 people shows a weak negative correlation between the proportion of Macedonians and percentage of population with at least master's degree education in the United States with a correlation coefficient (R) of -0.209 and weighted average of 16.7%, a difference of 3.3%.
Master's Degree Correlation Summary
| Measurement | Immigrants from Syria | Macedonian |
| Minimum | 3.4% | 1.8% |
| Maximum | 47.4% | 31.0% |
| Range | 44.0% | 29.2% |
| Mean | 16.8% | 15.1% |
| Median | 15.3% | 15.8% |
| Interquartile 25% (IQ1) | 13.0% | 11.8% |
| Interquartile 75% (IQ3) | 18.2% | 18.4% |
| Interquartile Range (IQR) | 5.2% | 6.6% |
| Standard Deviation (Sample) | 8.7% | 6.0% |
| Standard Deviation (Population) | 8.6% | 5.9% |
Demographics Similar to Immigrants from Syria and Macedonians by Master's Degree
In terms of master's degree, the demographic groups most similar to Immigrants from Syria are Immigrants from Jordan (16.1%, a difference of 0.26%), Immigrants from Sierra Leone (16.3%, a difference of 0.75%), Palestinian (16.3%, a difference of 0.80%), Immigrants from Eastern Africa (16.3%, a difference of 1.1%), and Italian (16.4%, a difference of 1.2%). Similarly, the demographic groups most similar to Macedonians are Arab (16.7%, a difference of 0.010%), Northern European (16.7%, a difference of 0.080%), Austrian (16.7%, a difference of 0.14%), Immigrants from Uganda (16.6%, a difference of 0.38%), and Immigrants from Chile (16.8%, a difference of 0.41%).
| Demographics | Rating | Rank | Master's Degree |
| Immigrants | Chile | 98.0 /100 | #110 | Exceptional 16.8% |
| Austrians | 97.8 /100 | #111 | Exceptional 16.7% |
| Macedonians | 97.7 /100 | #112 | Exceptional 16.7% |
| Arabs | 97.7 /100 | #113 | Exceptional 16.7% |
| Northern Europeans | 97.6 /100 | #114 | Exceptional 16.7% |
| Immigrants | Uganda | 97.3 /100 | #115 | Exceptional 16.6% |
| Immigrants | Southern Europe | 97.2 /100 | #116 | Exceptional 16.6% |
| Immigrants | Moldova | 97.2 /100 | #117 | Exceptional 16.6% |
| Brazilians | 96.8 /100 | #118 | Exceptional 16.5% |
| Jordanians | 96.5 /100 | #119 | Exceptional 16.5% |
| Lebanese | 96.4 /100 | #120 | Exceptional 16.5% |
| Afghans | 96.2 /100 | #121 | Exceptional 16.5% |
| British | 95.6 /100 | #122 | Exceptional 16.4% |
| Croatians | 95.6 /100 | #123 | Exceptional 16.4% |
| Immigrants | Eritrea | 95.5 /100 | #124 | Exceptional 16.4% |
| Italians | 95.4 /100 | #125 | Exceptional 16.4% |
| Immigrants | Eastern Africa | 95.2 /100 | #126 | Exceptional 16.3% |
| Palestinians | 94.8 /100 | #127 | Exceptional 16.3% |
| Immigrants | Sierra Leone | 94.7 /100 | #128 | Exceptional 16.3% |
| Immigrants | Syria | 93.3 /100 | #129 | Exceptional 16.2% |
| Immigrants | Jordan | 92.7 /100 | #130 | Exceptional 16.1% |