Icelander vs Immigrants from Poland Hearing Disability
COMPARE
Icelander
Immigrants from Poland
Hearing Disability
Hearing Disability Comparison
Icelanders
Immigrants from Poland
3.2%
HEARING DISABILITY
5.2/ 100
METRIC RATING
224th/ 347
METRIC RANK
2.9%
HEARING DISABILITY
70.2/ 100
METRIC RATING
156th/ 347
METRIC RANK
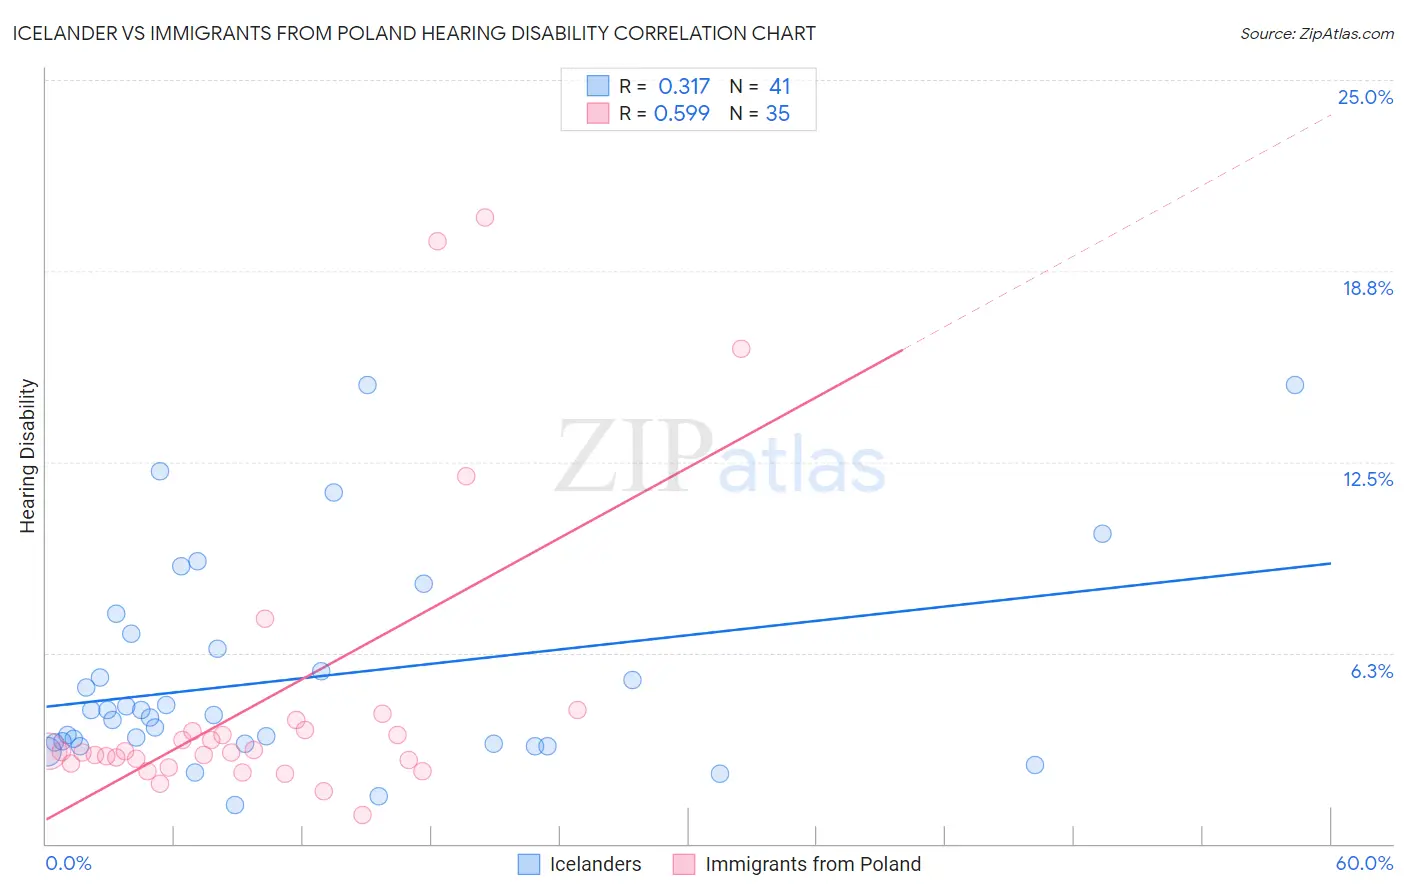
Icelander vs Immigrants from Poland Hearing Disability Correlation Chart
The statistical analysis conducted on geographies consisting of 159,637,999 people shows a mild positive correlation between the proportion of Icelanders and percentage of population with hearing disability in the United States with a correlation coefficient (R) of 0.317 and weighted average of 3.2%. Similarly, the statistical analysis conducted on geographies consisting of 304,813,024 people shows a substantial positive correlation between the proportion of Immigrants from Poland and percentage of population with hearing disability in the United States with a correlation coefficient (R) of 0.599 and weighted average of 2.9%, a difference of 9.0%.
Hearing Disability Correlation Summary
| Measurement | Icelander | Immigrants from Poland |
| Minimum | 1.3% | 0.95% |
| Maximum | 15.0% | 20.5% |
| Range | 13.7% | 19.6% |
| Mean | 5.4% | 4.7% |
| Median | 4.2% | 3.0% |
| Interquartile 25% (IQ1) | 3.3% | 2.6% |
| Interquartile 75% (IQ3) | 6.6% | 3.7% |
| Interquartile Range (IQR) | 3.4% | 1.1% |
| Standard Deviation (Sample) | 3.4% | 4.8% |
| Standard Deviation (Population) | 3.3% | 4.7% |
Similar Demographics by Hearing Disability
Demographics Similar to Icelanders by Hearing Disability
In terms of hearing disability, the demographic groups most similar to Icelanders are Latvian (3.2%, a difference of 0.040%), Lebanese (3.2%, a difference of 0.090%), Mexican (3.2%, a difference of 0.17%), Bhutanese (3.2%, a difference of 0.27%), and Immigrants from Portugal (3.2%, a difference of 0.47%).
| Demographics | Rating | Rank | Hearing Disability |
| Russians | 7.1 /100 | #217 | Tragic 3.2% |
| Immigrants | Northern Europe | 7.0 /100 | #218 | Tragic 3.2% |
| New Zealanders | 6.8 /100 | #219 | Tragic 3.2% |
| Malaysians | 6.6 /100 | #220 | Tragic 3.2% |
| Immigrants | Laos | 6.6 /100 | #221 | Tragic 3.2% |
| Immigrants | Oceania | 6.5 /100 | #222 | Tragic 3.2% |
| Mexicans | 5.6 /100 | #223 | Tragic 3.2% |
| Icelanders | 5.2 /100 | #224 | Tragic 3.2% |
| Latvians | 5.1 /100 | #225 | Tragic 3.2% |
| Lebanese | 5.0 /100 | #226 | Tragic 3.2% |
| Bhutanese | 4.6 /100 | #227 | Tragic 3.2% |
| Immigrants | Portugal | 4.3 /100 | #228 | Tragic 3.2% |
| Maltese | 4.1 /100 | #229 | Tragic 3.2% |
| Greeks | 3.2 /100 | #230 | Tragic 3.2% |
| Luxembourgers | 2.9 /100 | #231 | Tragic 3.2% |
Demographics Similar to Immigrants from Poland by Hearing Disability
In terms of hearing disability, the demographic groups most similar to Immigrants from Poland are Immigrants from Kazakhstan (2.9%, a difference of 0.070%), Immigrants from Burma/Myanmar (2.9%, a difference of 0.080%), Costa Rican (2.9%, a difference of 0.14%), Immigrants from Lebanon (2.9%, a difference of 0.15%), and Sudanese (2.9%, a difference of 0.23%).
| Demographics | Rating | Rank | Hearing Disability |
| Immigrants | Panama | 76.9 /100 | #149 | Good 2.9% |
| Palestinians | 73.6 /100 | #150 | Good 2.9% |
| Immigrants | France | 73.1 /100 | #151 | Good 2.9% |
| Immigrants | Lithuania | 73.0 /100 | #152 | Good 2.9% |
| Sudanese | 72.1 /100 | #153 | Good 2.9% |
| Immigrants | Lebanon | 71.5 /100 | #154 | Good 2.9% |
| Costa Ricans | 71.4 /100 | #155 | Good 2.9% |
| Immigrants | Poland | 70.2 /100 | #156 | Good 2.9% |
| Immigrants | Kazakhstan | 69.6 /100 | #157 | Good 2.9% |
| Immigrants | Burma/Myanmar | 69.5 /100 | #158 | Good 2.9% |
| Immigrants | Australia | 67.4 /100 | #159 | Good 2.9% |
| Immigrants | Fiji | 67.1 /100 | #160 | Good 2.9% |
| Albanians | 66.6 /100 | #161 | Good 2.9% |
| Immigrants | Japan | 66.3 /100 | #162 | Good 2.9% |
| Immigrants | Central America | 64.9 /100 | #163 | Good 3.0% |