Bermudan vs Immigrants from Poland No Schooling Completed
COMPARE
Bermudan
Immigrants from Poland
No Schooling Completed
No Schooling Completed Comparison
Bermudans
Immigrants from Poland
2.1%
NO SCHOOLING COMPLETED
30.7/ 100
METRIC RATING
191st/ 347
METRIC RANK
2.1%
NO SCHOOLING COMPLETED
55.2/ 100
METRIC RATING
171st/ 347
METRIC RANK
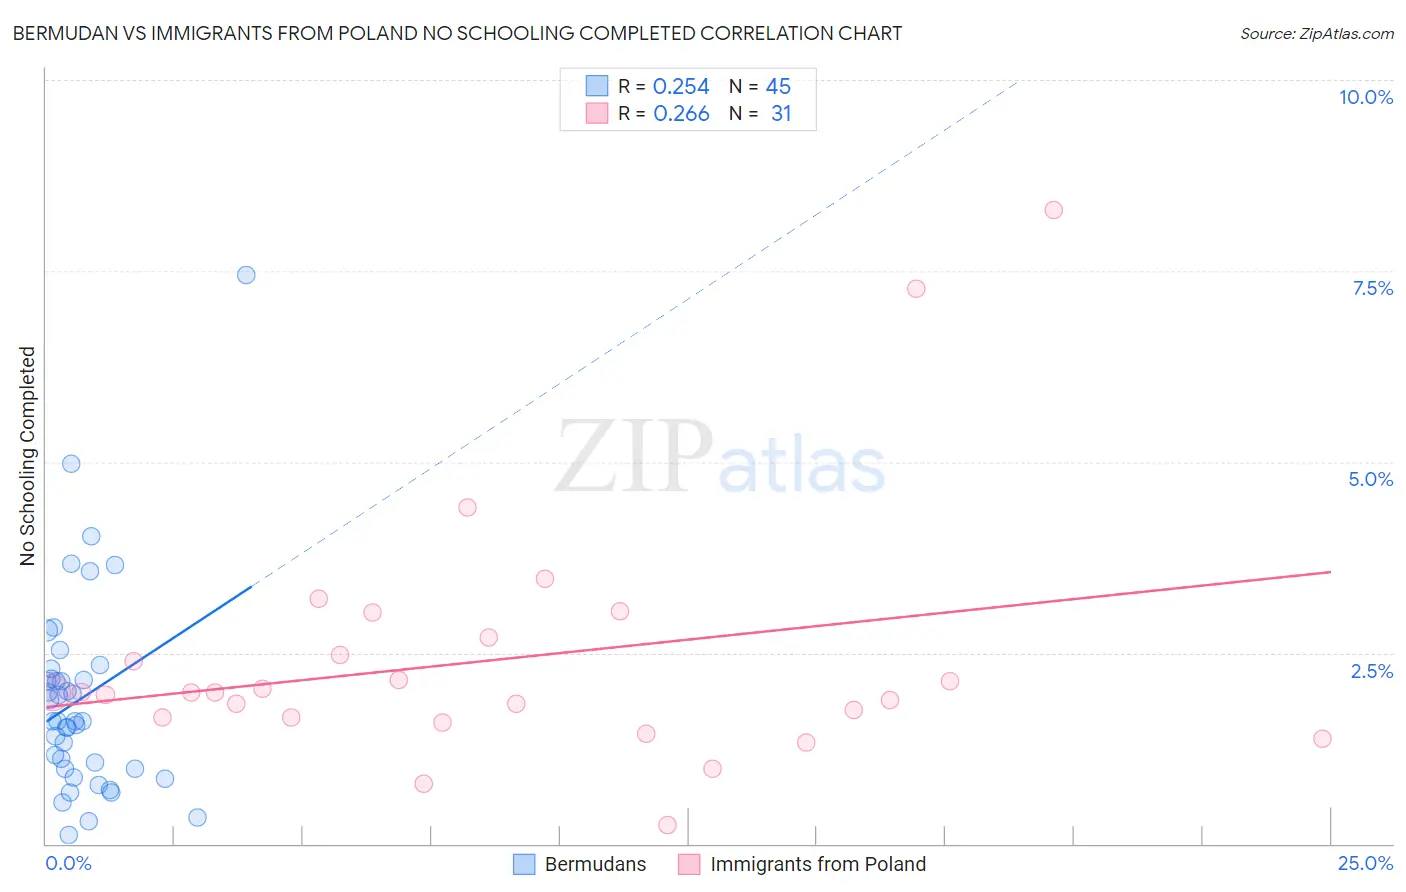
Bermudan vs Immigrants from Poland No Schooling Completed Correlation Chart
The statistical analysis conducted on geographies consisting of 55,639,195 people shows a weak positive correlation between the proportion of Bermudans and percentage of population with no schooling in the United States with a correlation coefficient (R) of 0.254 and weighted average of 2.1%. Similarly, the statistical analysis conducted on geographies consisting of 302,129,066 people shows a weak positive correlation between the proportion of Immigrants from Poland and percentage of population with no schooling in the United States with a correlation coefficient (R) of 0.266 and weighted average of 2.1%, a difference of 3.5%.
No Schooling Completed Correlation Summary
| Measurement | Bermudan | Immigrants from Poland |
| Minimum | 0.12% | 0.25% |
| Maximum | 7.4% | 8.3% |
| Range | 7.3% | 8.0% |
| Mean | 1.9% | 2.4% |
| Median | 1.6% | 2.0% |
| Interquartile 25% (IQ1) | 0.98% | 1.6% |
| Interquartile 75% (IQ3) | 2.2% | 2.7% |
| Interquartile Range (IQR) | 1.2% | 1.0% |
| Standard Deviation (Sample) | 1.3% | 1.7% |
| Standard Deviation (Population) | 1.3% | 1.6% |
Demographics Similar to Bermudans and Immigrants from Poland by No Schooling Completed
In terms of no schooling completed, the demographic groups most similar to Bermudans are Spanish American (2.1%, a difference of 0.29%), Immigrants from Kenya (2.1%, a difference of 0.81%), Immigrants from Egypt (2.1%, a difference of 0.81%), Navajo (2.1%, a difference of 0.87%), and Immigrants from Bosnia and Herzegovina (2.1%, a difference of 1.2%). Similarly, the demographic groups most similar to Immigrants from Poland are Immigrants from Argentina (2.1%, a difference of 0.33%), Immigrants from Belarus (2.1%, a difference of 0.46%), Immigrants from Micronesia (2.1%, a difference of 0.70%), Arab (2.1%, a difference of 1.2%), and Panamanian (2.1%, a difference of 1.4%).
| Demographics | Rating | Rank | No Schooling Completed |
| Immigrants | Poland | 55.2 /100 | #171 | Average 2.1% |
| Immigrants | Argentina | 52.7 /100 | #172 | Average 2.1% |
| Immigrants | Belarus | 51.8 /100 | #173 | Average 2.1% |
| Immigrants | Micronesia | 50.0 /100 | #174 | Average 2.1% |
| Arabs | 46.4 /100 | #175 | Average 2.1% |
| Panamanians | 45.2 /100 | #176 | Average 2.1% |
| Arapaho | 45.0 /100 | #177 | Average 2.1% |
| Pakistanis | 44.7 /100 | #178 | Average 2.1% |
| Immigrants | Kazakhstan | 44.3 /100 | #179 | Average 2.1% |
| Portuguese | 43.9 /100 | #180 | Average 2.1% |
| Immigrants | Taiwan | 42.6 /100 | #181 | Average 2.1% |
| French American Indians | 42.2 /100 | #182 | Average 2.1% |
| Blacks/African Americans | 41.4 /100 | #183 | Average 2.1% |
| Pima | 41.3 /100 | #184 | Average 2.1% |
| Mongolians | 40.8 /100 | #185 | Average 2.1% |
| Immigrants | Bosnia and Herzegovina | 38.6 /100 | #186 | Fair 2.1% |
| Navajo | 36.5 /100 | #187 | Fair 2.1% |
| Immigrants | Kenya | 36.2 /100 | #188 | Fair 2.1% |
| Immigrants | Egypt | 36.1 /100 | #189 | Fair 2.1% |
| Spanish Americans | 32.6 /100 | #190 | Fair 2.1% |
| Bermudans | 30.7 /100 | #191 | Fair 2.1% |