Irish vs Lumbee Master's Degree
COMPARE
Irish
Lumbee
Master's Degree
Master's Degree Comparison
Irish
Lumbee
15.0%
MASTER'S DEGREE
56.3/ 100
METRIC RATING
170th/ 347
METRIC RANK
9.3%
MASTER'S DEGREE
0.0/ 100
METRIC RATING
343rd/ 347
METRIC RANK
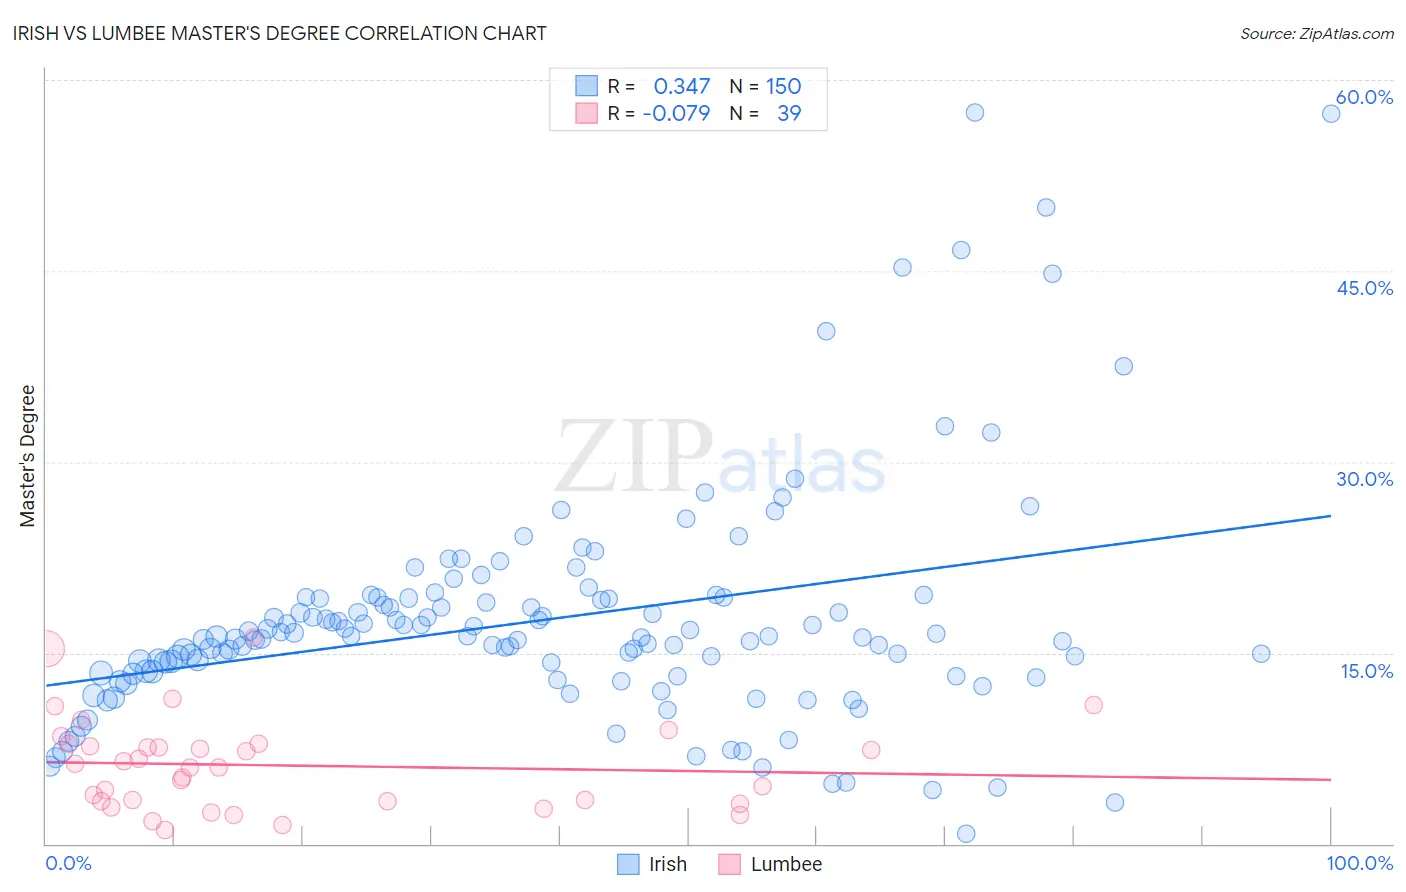
Irish vs Lumbee Master's Degree Correlation Chart
The statistical analysis conducted on geographies consisting of 579,087,481 people shows a mild positive correlation between the proportion of Irish and percentage of population with at least master's degree education in the United States with a correlation coefficient (R) of 0.347 and weighted average of 15.0%. Similarly, the statistical analysis conducted on geographies consisting of 92,286,127 people shows a slight negative correlation between the proportion of Lumbee and percentage of population with at least master's degree education in the United States with a correlation coefficient (R) of -0.079 and weighted average of 9.3%, a difference of 62.4%.
Master's Degree Correlation Summary
| Measurement | Irish | Lumbee |
| Minimum | 0.78% | 1.0% |
| Maximum | 57.5% | 16.2% |
| Range | 56.7% | 15.2% |
| Mean | 17.6% | 6.2% |
| Median | 16.3% | 6.0% |
| Interquartile 25% (IQ1) | 13.4% | 3.3% |
| Interquartile 75% (IQ3) | 19.3% | 7.8% |
| Interquartile Range (IQR) | 5.9% | 4.5% |
| Standard Deviation (Sample) | 9.0% | 3.6% |
| Standard Deviation (Population) | 9.0% | 3.5% |
Similar Demographics by Master's Degree
Demographics Similar to Irish by Master's Degree
In terms of master's degree, the demographic groups most similar to Irish are Immigrants from Ghana (15.0%, a difference of 0.35%), Immigrants from Uruguay (15.0%, a difference of 0.46%), Costa Rican (15.0%, a difference of 0.50%), Slovak (14.9%, a difference of 0.81%), and Scottish (15.2%, a difference of 0.84%).
| Demographics | Rating | Rank | Master's Degree |
| Uruguayans | 67.1 /100 | #163 | Good 15.3% |
| Colombians | 66.9 /100 | #164 | Good 15.3% |
| Immigrants | Kenya | 66.6 /100 | #165 | Good 15.3% |
| Swedes | 66.1 /100 | #166 | Good 15.2% |
| Senegalese | 65.6 /100 | #167 | Good 15.2% |
| Immigrants | North Macedonia | 64.5 /100 | #168 | Good 15.2% |
| Scottish | 62.7 /100 | #169 | Good 15.2% |
| Irish | 56.3 /100 | #170 | Average 15.0% |
| Immigrants | Ghana | 53.6 /100 | #171 | Average 15.0% |
| Immigrants | Uruguay | 52.8 /100 | #172 | Average 15.0% |
| Costa Ricans | 52.5 /100 | #173 | Average 15.0% |
| Slovaks | 50.0 /100 | #174 | Average 14.9% |
| Immigrants | Peru | 49.6 /100 | #175 | Average 14.9% |
| Nigerians | 48.6 /100 | #176 | Average 14.9% |
| Immigrants | Colombia | 48.3 /100 | #177 | Average 14.9% |
Demographics Similar to Lumbee by Master's Degree
In terms of master's degree, the demographic groups most similar to Lumbee are Pima (9.2%, a difference of 0.17%), Yuman (9.2%, a difference of 0.32%), Immigrants from Mexico (9.3%, a difference of 0.48%), Navajo (9.4%, a difference of 1.8%), and Yakama (9.5%, a difference of 2.1%).
| Demographics | Rating | Rank | Master's Degree |
| Menominee | 0.0 /100 | #333 | Tragic 10.2% |
| Arapaho | 0.0 /100 | #334 | Tragic 10.0% |
| Immigrants | Central America | 0.0 /100 | #335 | Tragic 10.0% |
| Natives/Alaskans | 0.0 /100 | #336 | Tragic 9.9% |
| Mexicans | 0.0 /100 | #337 | Tragic 9.7% |
| Tohono O'odham | 0.0 /100 | #338 | Tragic 9.7% |
| Spanish American Indians | 0.0 /100 | #339 | Tragic 9.6% |
| Yakama | 0.0 /100 | #340 | Tragic 9.5% |
| Navajo | 0.0 /100 | #341 | Tragic 9.4% |
| Immigrants | Mexico | 0.0 /100 | #342 | Tragic 9.3% |
| Lumbee | 0.0 /100 | #343 | Tragic 9.3% |
| Pima | 0.0 /100 | #344 | Tragic 9.2% |
| Yuman | 0.0 /100 | #345 | Tragic 9.2% |
| Yup'ik | 0.0 /100 | #346 | Tragic 8.5% |
| Houma | 0.0 /100 | #347 | Tragic 7.9% |