Immigrants from Albania vs Lumbee Master's Degree
COMPARE
Immigrants from Albania
Lumbee
Master's Degree
Master's Degree Comparison
Immigrants from Albania
Lumbee
16.8%
MASTER'S DEGREE
98.1/ 100
METRIC RATING
106th/ 347
METRIC RANK
9.3%
MASTER'S DEGREE
0.0/ 100
METRIC RATING
343rd/ 347
METRIC RANK
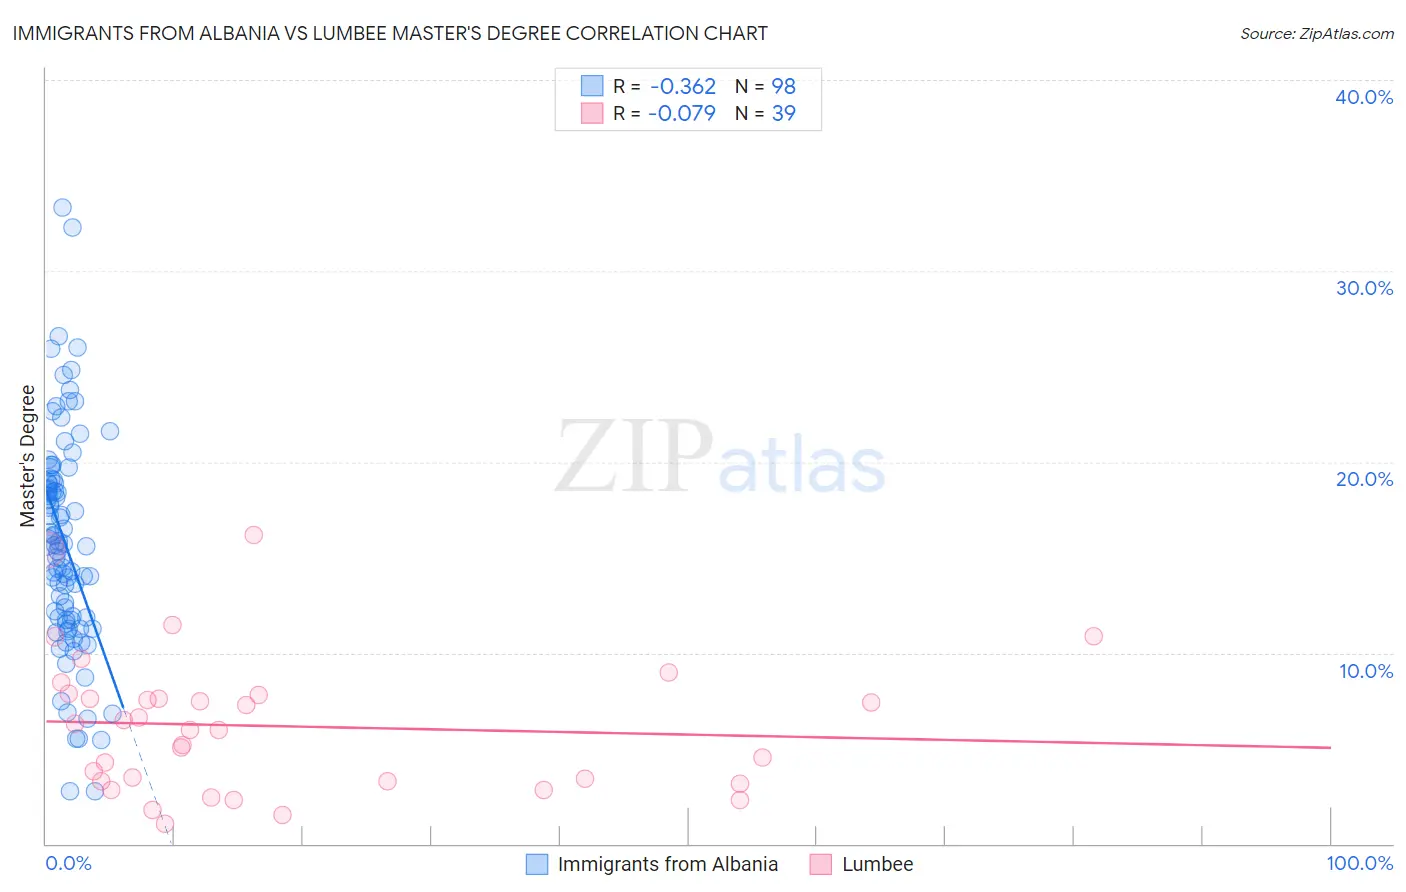
Immigrants from Albania vs Lumbee Master's Degree Correlation Chart
The statistical analysis conducted on geographies consisting of 119,391,185 people shows a mild negative correlation between the proportion of Immigrants from Albania and percentage of population with at least master's degree education in the United States with a correlation coefficient (R) of -0.362 and weighted average of 16.8%. Similarly, the statistical analysis conducted on geographies consisting of 92,286,127 people shows a slight negative correlation between the proportion of Lumbee and percentage of population with at least master's degree education in the United States with a correlation coefficient (R) of -0.079 and weighted average of 9.3%, a difference of 81.3%.
Master's Degree Correlation Summary
| Measurement | Immigrants from Albania | Lumbee |
| Minimum | 2.7% | 1.0% |
| Maximum | 33.3% | 16.2% |
| Range | 30.6% | 15.2% |
| Mean | 15.7% | 6.2% |
| Median | 15.6% | 6.0% |
| Interquartile 25% (IQ1) | 11.7% | 3.3% |
| Interquartile 75% (IQ3) | 18.9% | 7.8% |
| Interquartile Range (IQR) | 7.1% | 4.5% |
| Standard Deviation (Sample) | 5.8% | 3.6% |
| Standard Deviation (Population) | 5.7% | 3.5% |
Similar Demographics by Master's Degree
Demographics Similar to Immigrants from Albania by Master's Degree
In terms of master's degree, the demographic groups most similar to Immigrants from Albania are Armenian (16.8%, a difference of 0.090%), Sierra Leonean (16.8%, a difference of 0.12%), Moroccan (16.8%, a difference of 0.14%), Immigrants from Chile (16.8%, a difference of 0.17%), and Syrian (16.8%, a difference of 0.28%).
| Demographics | Rating | Rank | Master's Degree |
| Laotians | 98.8 /100 | #99 | Exceptional 17.0% |
| Albanians | 98.7 /100 | #100 | Exceptional 17.0% |
| Immigrants | Nepal | 98.6 /100 | #101 | Exceptional 17.0% |
| Chileans | 98.6 /100 | #102 | Exceptional 16.9% |
| Alsatians | 98.4 /100 | #103 | Exceptional 16.9% |
| Ukrainians | 98.3 /100 | #104 | Exceptional 16.9% |
| Syrians | 98.3 /100 | #105 | Exceptional 16.8% |
| Immigrants | Albania | 98.1 /100 | #106 | Exceptional 16.8% |
| Armenians | 98.0 /100 | #107 | Exceptional 16.8% |
| Sierra Leoneans | 98.0 /100 | #108 | Exceptional 16.8% |
| Moroccans | 98.0 /100 | #109 | Exceptional 16.8% |
| Immigrants | Chile | 98.0 /100 | #110 | Exceptional 16.8% |
| Austrians | 97.8 /100 | #111 | Exceptional 16.7% |
| Macedonians | 97.7 /100 | #112 | Exceptional 16.7% |
| Arabs | 97.7 /100 | #113 | Exceptional 16.7% |
Demographics Similar to Lumbee by Master's Degree
In terms of master's degree, the demographic groups most similar to Lumbee are Pima (9.2%, a difference of 0.17%), Yuman (9.2%, a difference of 0.32%), Immigrants from Mexico (9.3%, a difference of 0.48%), Navajo (9.4%, a difference of 1.8%), and Yakama (9.5%, a difference of 2.1%).
| Demographics | Rating | Rank | Master's Degree |
| Menominee | 0.0 /100 | #333 | Tragic 10.2% |
| Arapaho | 0.0 /100 | #334 | Tragic 10.0% |
| Immigrants | Central America | 0.0 /100 | #335 | Tragic 10.0% |
| Natives/Alaskans | 0.0 /100 | #336 | Tragic 9.9% |
| Mexicans | 0.0 /100 | #337 | Tragic 9.7% |
| Tohono O'odham | 0.0 /100 | #338 | Tragic 9.7% |
| Spanish American Indians | 0.0 /100 | #339 | Tragic 9.6% |
| Yakama | 0.0 /100 | #340 | Tragic 9.5% |
| Navajo | 0.0 /100 | #341 | Tragic 9.4% |
| Immigrants | Mexico | 0.0 /100 | #342 | Tragic 9.3% |
| Lumbee | 0.0 /100 | #343 | Tragic 9.3% |
| Pima | 0.0 /100 | #344 | Tragic 9.2% |
| Yuman | 0.0 /100 | #345 | Tragic 9.2% |
| Yup'ik | 0.0 /100 | #346 | Tragic 8.5% |
| Houma | 0.0 /100 | #347 | Tragic 7.9% |