Hopi vs Lumbee Master's Degree
COMPARE
Hopi
Lumbee
Master's Degree
Master's Degree Comparison
Hopi
Lumbee
10.9%
MASTER'S DEGREE
0.0/ 100
METRIC RATING
317th/ 347
METRIC RANK
9.3%
MASTER'S DEGREE
0.0/ 100
METRIC RATING
343rd/ 347
METRIC RANK
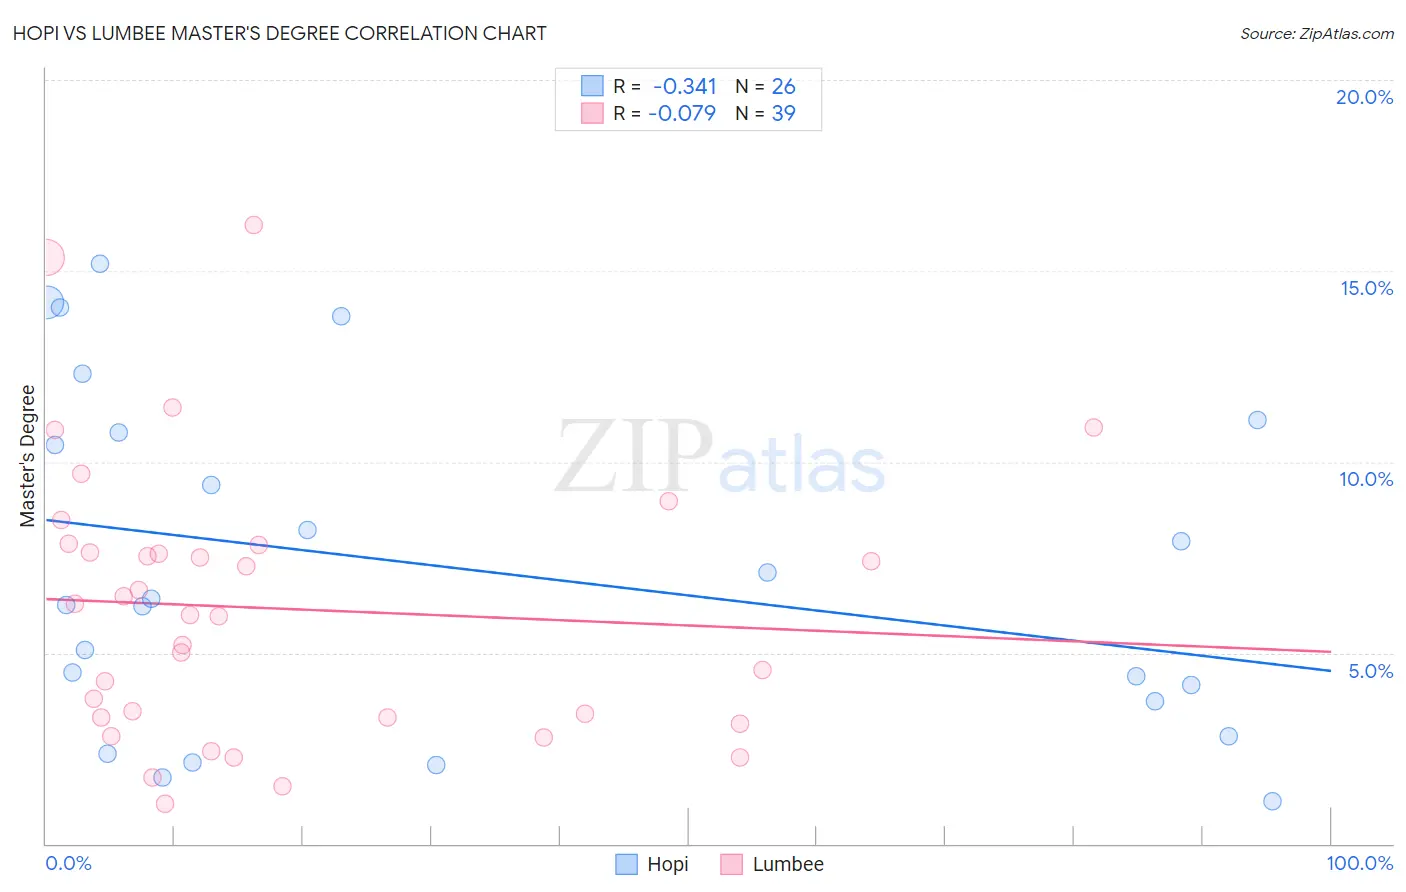
Hopi vs Lumbee Master's Degree Correlation Chart
The statistical analysis conducted on geographies consisting of 74,729,525 people shows a mild negative correlation between the proportion of Hopi and percentage of population with at least master's degree education in the United States with a correlation coefficient (R) of -0.341 and weighted average of 10.9%. Similarly, the statistical analysis conducted on geographies consisting of 92,286,127 people shows a slight negative correlation between the proportion of Lumbee and percentage of population with at least master's degree education in the United States with a correlation coefficient (R) of -0.079 and weighted average of 9.3%, a difference of 17.3%.
Master's Degree Correlation Summary
| Measurement | Hopi | Lumbee |
| Minimum | 1.1% | 1.0% |
| Maximum | 15.2% | 16.2% |
| Range | 14.1% | 15.2% |
| Mean | 7.2% | 6.2% |
| Median | 6.3% | 6.0% |
| Interquartile 25% (IQ1) | 3.7% | 3.3% |
| Interquartile 75% (IQ3) | 10.8% | 7.8% |
| Interquartile Range (IQR) | 7.0% | 4.5% |
| Standard Deviation (Sample) | 4.4% | 3.6% |
| Standard Deviation (Population) | 4.3% | 3.5% |
Similar Demographics by Master's Degree
Demographics Similar to Hopi by Master's Degree
In terms of master's degree, the demographic groups most similar to Hopi are Immigrants from Cuba (10.9%, a difference of 0.13%), Kiowa (10.8%, a difference of 0.37%), Hispanic or Latino (10.9%, a difference of 0.54%), Cajun (11.0%, a difference of 0.88%), and Apache (11.0%, a difference of 0.88%).
| Demographics | Rating | Rank | Master's Degree |
| Shoshone | 0.0 /100 | #310 | Tragic 11.1% |
| Seminole | 0.0 /100 | #311 | Tragic 11.0% |
| Choctaw | 0.0 /100 | #312 | Tragic 11.0% |
| Yaqui | 0.0 /100 | #313 | Tragic 11.0% |
| Cajuns | 0.0 /100 | #314 | Tragic 11.0% |
| Apache | 0.0 /100 | #315 | Tragic 11.0% |
| Hispanics or Latinos | 0.0 /100 | #316 | Tragic 10.9% |
| Hopi | 0.0 /100 | #317 | Tragic 10.9% |
| Immigrants | Cuba | 0.0 /100 | #318 | Tragic 10.9% |
| Kiowa | 0.0 /100 | #319 | Tragic 10.8% |
| Immigrants | Micronesia | 0.0 /100 | #320 | Tragic 10.8% |
| Pennsylvania Germans | 0.0 /100 | #321 | Tragic 10.7% |
| Sioux | 0.0 /100 | #322 | Tragic 10.7% |
| Crow | 0.0 /100 | #323 | Tragic 10.6% |
| Dutch West Indians | 0.0 /100 | #324 | Tragic 10.6% |
Demographics Similar to Lumbee by Master's Degree
In terms of master's degree, the demographic groups most similar to Lumbee are Pima (9.2%, a difference of 0.17%), Yuman (9.2%, a difference of 0.32%), Immigrants from Mexico (9.3%, a difference of 0.48%), Navajo (9.4%, a difference of 1.8%), and Yakama (9.5%, a difference of 2.1%).
| Demographics | Rating | Rank | Master's Degree |
| Menominee | 0.0 /100 | #333 | Tragic 10.2% |
| Arapaho | 0.0 /100 | #334 | Tragic 10.0% |
| Immigrants | Central America | 0.0 /100 | #335 | Tragic 10.0% |
| Natives/Alaskans | 0.0 /100 | #336 | Tragic 9.9% |
| Mexicans | 0.0 /100 | #337 | Tragic 9.7% |
| Tohono O'odham | 0.0 /100 | #338 | Tragic 9.7% |
| Spanish American Indians | 0.0 /100 | #339 | Tragic 9.6% |
| Yakama | 0.0 /100 | #340 | Tragic 9.5% |
| Navajo | 0.0 /100 | #341 | Tragic 9.4% |
| Immigrants | Mexico | 0.0 /100 | #342 | Tragic 9.3% |
| Lumbee | 0.0 /100 | #343 | Tragic 9.3% |
| Pima | 0.0 /100 | #344 | Tragic 9.2% |
| Yuman | 0.0 /100 | #345 | Tragic 9.2% |
| Yup'ik | 0.0 /100 | #346 | Tragic 8.5% |
| Houma | 0.0 /100 | #347 | Tragic 7.9% |