Immigrants from Iraq vs Lumbee Master's Degree
COMPARE
Immigrants from Iraq
Lumbee
Master's Degree
Master's Degree Comparison
Immigrants from Iraq
Lumbee
14.8%
MASTER'S DEGREE
41.3/ 100
METRIC RATING
179th/ 347
METRIC RANK
9.3%
MASTER'S DEGREE
0.0/ 100
METRIC RATING
343rd/ 347
METRIC RANK
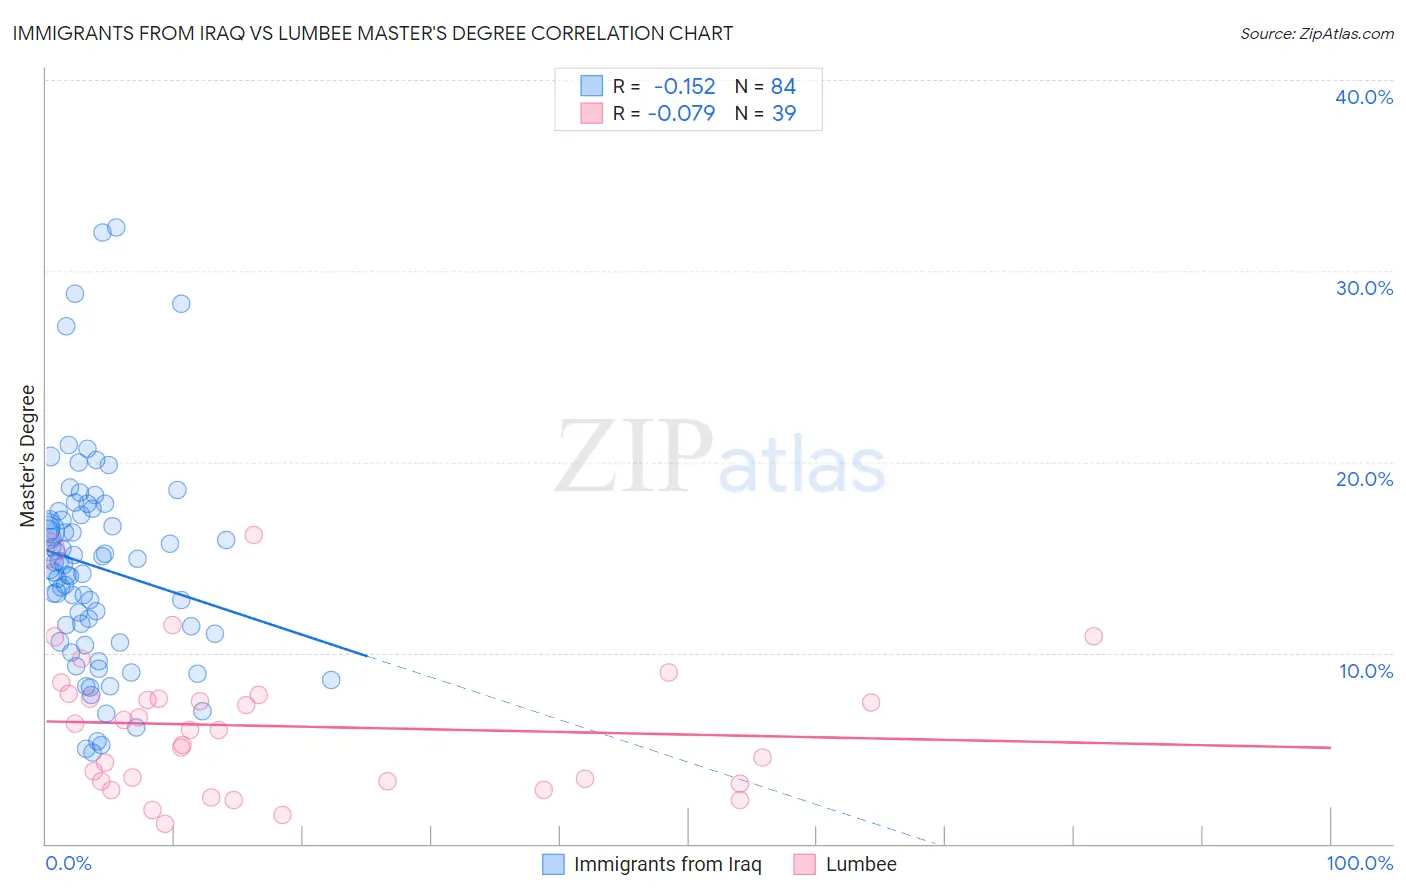
Immigrants from Iraq vs Lumbee Master's Degree Correlation Chart
The statistical analysis conducted on geographies consisting of 194,768,145 people shows a poor negative correlation between the proportion of Immigrants from Iraq and percentage of population with at least master's degree education in the United States with a correlation coefficient (R) of -0.152 and weighted average of 14.8%. Similarly, the statistical analysis conducted on geographies consisting of 92,286,127 people shows a slight negative correlation between the proportion of Lumbee and percentage of population with at least master's degree education in the United States with a correlation coefficient (R) of -0.079 and weighted average of 9.3%, a difference of 59.2%.
Master's Degree Correlation Summary
| Measurement | Immigrants from Iraq | Lumbee |
| Minimum | 4.8% | 1.0% |
| Maximum | 32.3% | 16.2% |
| Range | 27.5% | 15.2% |
| Mean | 14.5% | 6.2% |
| Median | 14.5% | 6.0% |
| Interquartile 25% (IQ1) | 10.8% | 3.3% |
| Interquartile 75% (IQ3) | 17.1% | 7.8% |
| Interquartile Range (IQR) | 6.3% | 4.5% |
| Standard Deviation (Sample) | 5.6% | 3.6% |
| Standard Deviation (Population) | 5.5% | 3.5% |
Similar Demographics by Master's Degree
Demographics Similar to Immigrants from Iraq by Master's Degree
In terms of master's degree, the demographic groups most similar to Immigrants from Iraq are Celtic (14.8%, a difference of 0.010%), Swiss (14.7%, a difference of 0.030%), Czech (14.7%, a difference of 0.13%), Sri Lankan (14.7%, a difference of 0.23%), and Immigrants from Zaire (14.7%, a difference of 0.25%).
| Demographics | Rating | Rank | Master's Degree |
| Immigrants | Uruguay | 52.8 /100 | #172 | Average 15.0% |
| Costa Ricans | 52.5 /100 | #173 | Average 15.0% |
| Slovaks | 50.0 /100 | #174 | Average 14.9% |
| Immigrants | Peru | 49.6 /100 | #175 | Average 14.9% |
| Nigerians | 48.6 /100 | #176 | Average 14.9% |
| Immigrants | Colombia | 48.3 /100 | #177 | Average 14.9% |
| English | 45.0 /100 | #178 | Average 14.8% |
| Immigrants | Iraq | 41.3 /100 | #179 | Average 14.8% |
| Celtics | 41.3 /100 | #180 | Average 14.8% |
| Swiss | 41.1 /100 | #181 | Average 14.7% |
| Czechs | 40.4 /100 | #182 | Average 14.7% |
| Sri Lankans | 39.6 /100 | #183 | Fair 14.7% |
| Immigrants | Zaire | 39.5 /100 | #184 | Fair 14.7% |
| Barbadians | 38.3 /100 | #185 | Fair 14.7% |
| Immigrants | Oceania | 37.1 /100 | #186 | Fair 14.7% |
Demographics Similar to Lumbee by Master's Degree
In terms of master's degree, the demographic groups most similar to Lumbee are Pima (9.2%, a difference of 0.17%), Yuman (9.2%, a difference of 0.32%), Immigrants from Mexico (9.3%, a difference of 0.48%), Navajo (9.4%, a difference of 1.8%), and Yakama (9.5%, a difference of 2.1%).
| Demographics | Rating | Rank | Master's Degree |
| Menominee | 0.0 /100 | #333 | Tragic 10.2% |
| Arapaho | 0.0 /100 | #334 | Tragic 10.0% |
| Immigrants | Central America | 0.0 /100 | #335 | Tragic 10.0% |
| Natives/Alaskans | 0.0 /100 | #336 | Tragic 9.9% |
| Mexicans | 0.0 /100 | #337 | Tragic 9.7% |
| Tohono O'odham | 0.0 /100 | #338 | Tragic 9.7% |
| Spanish American Indians | 0.0 /100 | #339 | Tragic 9.6% |
| Yakama | 0.0 /100 | #340 | Tragic 9.5% |
| Navajo | 0.0 /100 | #341 | Tragic 9.4% |
| Immigrants | Mexico | 0.0 /100 | #342 | Tragic 9.3% |
| Lumbee | 0.0 /100 | #343 | Tragic 9.3% |
| Pima | 0.0 /100 | #344 | Tragic 9.2% |
| Yuman | 0.0 /100 | #345 | Tragic 9.2% |
| Yup'ik | 0.0 /100 | #346 | Tragic 8.5% |
| Houma | 0.0 /100 | #347 | Tragic 7.9% |