Ute vs Immigrants from Norway No Schooling Completed
COMPARE
Ute
Immigrants from Norway
No Schooling Completed
No Schooling Completed Comparison
Ute
Immigrants from Norway
2.3%
NO SCHOOLING COMPLETED
8.2/ 100
METRIC RATING
213th/ 347
METRIC RANK
1.9%
NO SCHOOLING COMPLETED
96.1/ 100
METRIC RATING
114th/ 347
METRIC RANK
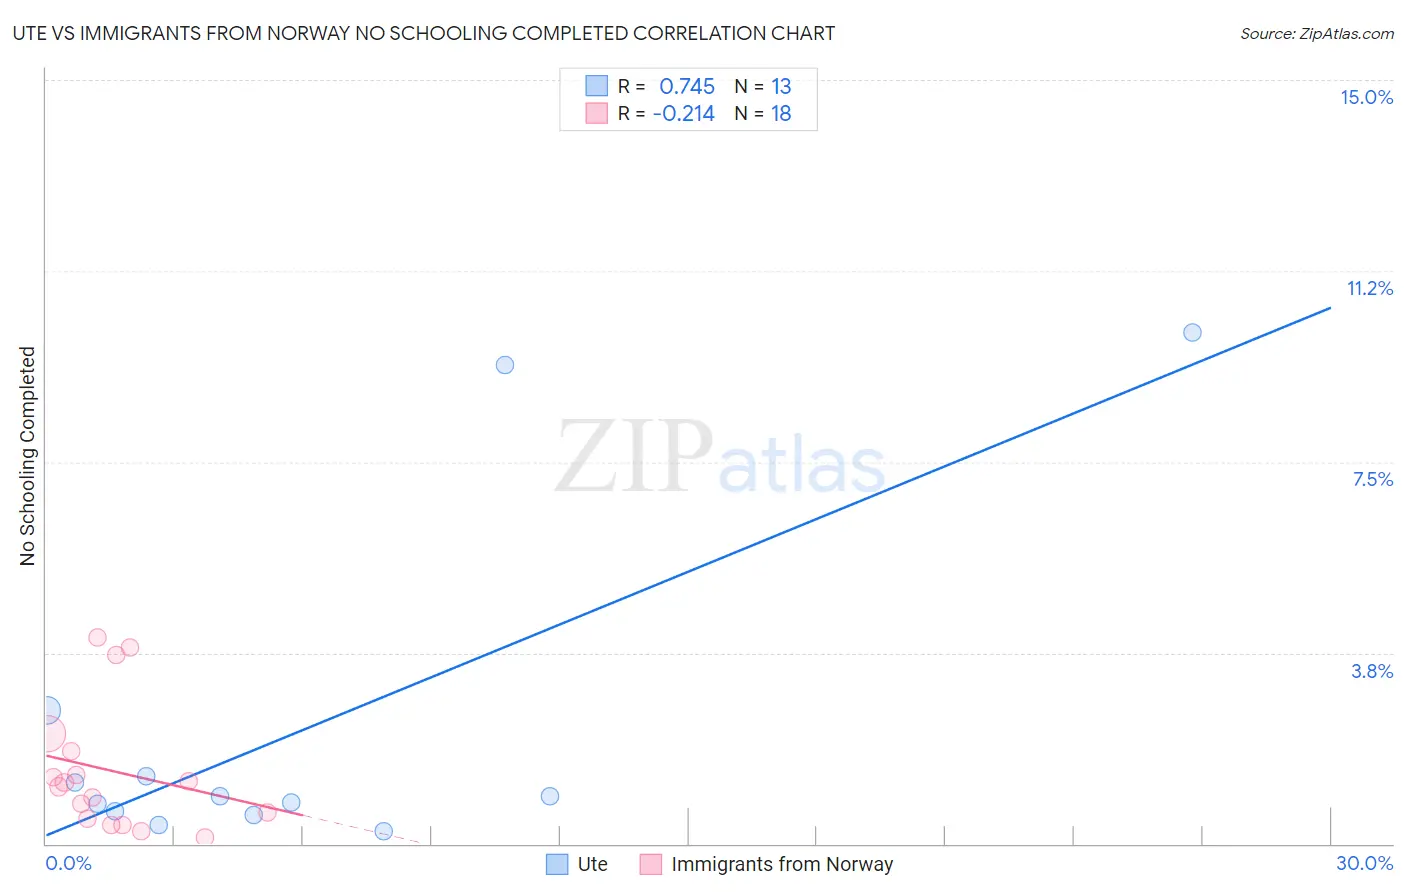
Ute vs Immigrants from Norway No Schooling Completed Correlation Chart
The statistical analysis conducted on geographies consisting of 55,448,088 people shows a strong positive correlation between the proportion of Ute and percentage of population with no schooling in the United States with a correlation coefficient (R) of 0.745 and weighted average of 2.3%. Similarly, the statistical analysis conducted on geographies consisting of 116,062,009 people shows a weak negative correlation between the proportion of Immigrants from Norway and percentage of population with no schooling in the United States with a correlation coefficient (R) of -0.214 and weighted average of 1.9%, a difference of 21.2%.
No Schooling Completed Correlation Summary
| Measurement | Ute | Immigrants from Norway |
| Minimum | 0.24% | 0.13% |
| Maximum | 10.1% | 4.0% |
| Range | 9.8% | 3.9% |
| Mean | 2.3% | 1.4% |
| Median | 0.92% | 1.2% |
| Interquartile 25% (IQ1) | 0.61% | 0.50% |
| Interquartile 75% (IQ3) | 2.0% | 1.8% |
| Interquartile Range (IQR) | 1.4% | 1.3% |
| Standard Deviation (Sample) | 3.4% | 1.2% |
| Standard Deviation (Population) | 3.2% | 1.2% |
Similar Demographics by No Schooling Completed
Demographics Similar to Ute by No Schooling Completed
In terms of no schooling completed, the demographic groups most similar to Ute are Samoan (2.3%, a difference of 0.040%), Immigrants from Morocco (2.3%, a difference of 0.19%), Immigrants from Panama (2.3%, a difference of 0.20%), Immigrants from Zaire (2.3%, a difference of 0.47%), and Native/Alaskan (2.2%, a difference of 0.66%).
| Demographics | Rating | Rank | No Schooling Completed |
| Bahamians | 11.6 /100 | #206 | Poor 2.2% |
| South American Indians | 11.0 /100 | #207 | Poor 2.2% |
| Uruguayans | 11.0 /100 | #208 | Poor 2.2% |
| Immigrants | Oceania | 10.2 /100 | #209 | Poor 2.2% |
| Natives/Alaskans | 10.0 /100 | #210 | Tragic 2.2% |
| Immigrants | Panama | 8.8 /100 | #211 | Tragic 2.3% |
| Immigrants | Morocco | 8.7 /100 | #212 | Tragic 2.3% |
| Ute | 8.2 /100 | #213 | Tragic 2.3% |
| Samoans | 8.2 /100 | #214 | Tragic 2.3% |
| Immigrants | Zaire | 7.2 /100 | #215 | Tragic 2.3% |
| Tongans | 6.8 /100 | #216 | Tragic 2.3% |
| Immigrants | Syria | 6.6 /100 | #217 | Tragic 2.3% |
| Immigrants | Nepal | 6.4 /100 | #218 | Tragic 2.3% |
| Senegalese | 5.6 /100 | #219 | Tragic 2.3% |
| Immigrants | Costa Rica | 5.1 /100 | #220 | Tragic 2.3% |
Demographics Similar to Immigrants from Norway by No Schooling Completed
In terms of no schooling completed, the demographic groups most similar to Immigrants from Norway are Immigrants from Zimbabwe (1.9%, a difference of 0.010%), Syrian (1.9%, a difference of 0.13%), Lebanese (1.9%, a difference of 0.15%), Pueblo (1.9%, a difference of 0.25%), and Immigrants from Serbia (1.9%, a difference of 0.35%).
| Demographics | Rating | Rank | No Schooling Completed |
| Yugoslavians | 97.2 /100 | #107 | Exceptional 1.8% |
| Okinawans | 97.1 /100 | #108 | Exceptional 1.8% |
| Immigrants | Saudi Arabia | 96.8 /100 | #109 | Exceptional 1.9% |
| Immigrants | Latvia | 96.7 /100 | #110 | Exceptional 1.9% |
| Immigrants | Japan | 96.6 /100 | #111 | Exceptional 1.9% |
| Pueblo | 96.4 /100 | #112 | Exceptional 1.9% |
| Immigrants | Zimbabwe | 96.2 /100 | #113 | Exceptional 1.9% |
| Immigrants | Norway | 96.1 /100 | #114 | Exceptional 1.9% |
| Syrians | 96.0 /100 | #115 | Exceptional 1.9% |
| Lebanese | 96.0 /100 | #116 | Exceptional 1.9% |
| Immigrants | Serbia | 95.8 /100 | #117 | Exceptional 1.9% |
| Spanish | 95.5 /100 | #118 | Exceptional 1.9% |
| Iroquois | 95.1 /100 | #119 | Exceptional 1.9% |
| Immigrants | Bulgaria | 94.6 /100 | #120 | Exceptional 1.9% |
| Immigrants | Croatia | 94.5 /100 | #121 | Exceptional 1.9% |