Houma vs Yugoslavian 4th Grade
COMPARE
Houma
Yugoslavian
4th Grade
4th Grade Comparison
Houma
Yugoslavians
96.8%
4TH GRADE
0.0/ 100
METRIC RATING
287th/ 347
METRIC RANK
97.9%
4TH GRADE
98.1/ 100
METRIC RATING
100th/ 347
METRIC RANK
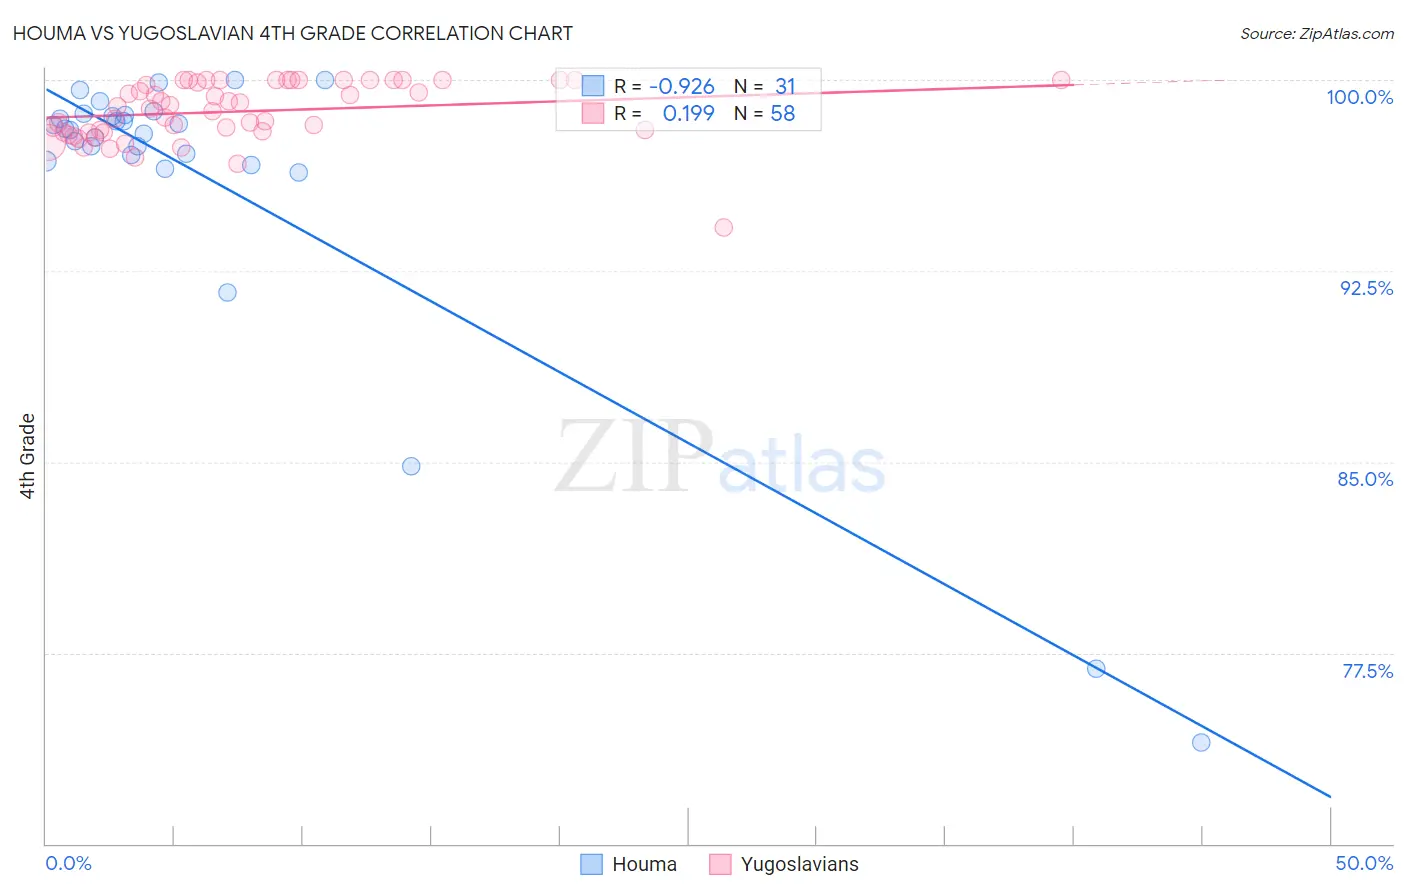
Houma vs Yugoslavian 4th Grade Correlation Chart
The statistical analysis conducted on geographies consisting of 36,795,916 people shows a near-perfect negative correlation between the proportion of Houma and percentage of population with at least 4th grade education in the United States with a correlation coefficient (R) of -0.926 and weighted average of 96.8%. Similarly, the statistical analysis conducted on geographies consisting of 285,618,157 people shows a poor positive correlation between the proportion of Yugoslavians and percentage of population with at least 4th grade education in the United States with a correlation coefficient (R) of 0.199 and weighted average of 97.9%, a difference of 1.1%.
4th Grade Correlation Summary
| Measurement | Houma | Yugoslavian |
| Minimum | 74.0% | 94.2% |
| Maximum | 100.0% | 100.0% |
| Range | 26.0% | 5.8% |
| Mean | 96.0% | 98.8% |
| Median | 98.1% | 98.9% |
| Interquartile 25% (IQ1) | 96.8% | 97.9% |
| Interquartile 75% (IQ3) | 98.6% | 100.0% |
| Interquartile Range (IQR) | 1.8% | 2.1% |
| Standard Deviation (Sample) | 6.2% | 1.2% |
| Standard Deviation (Population) | 6.1% | 1.2% |
Similar Demographics by 4th Grade
Demographics Similar to Houma by 4th Grade
In terms of 4th grade, the demographic groups most similar to Houma are Immigrants from Afghanistan (96.8%, a difference of 0.0%), Immigrants from West Indies (96.7%, a difference of 0.020%), British West Indian (96.7%, a difference of 0.030%), Immigrants from Barbados (96.8%, a difference of 0.040%), and Immigrants from Thailand (96.8%, a difference of 0.040%).
| Demographics | Rating | Rank | 4th Grade |
| Barbadians | 0.1 /100 | #280 | Tragic 96.9% |
| Immigrants | Hong Kong | 0.1 /100 | #281 | Tragic 96.9% |
| Immigrants | Trinidad and Tobago | 0.1 /100 | #282 | Tragic 96.8% |
| Immigrants | Philippines | 0.1 /100 | #283 | Tragic 96.8% |
| Immigrants | St. Vincent and the Grenadines | 0.1 /100 | #284 | Tragic 96.8% |
| Immigrants | Barbados | 0.0 /100 | #285 | Tragic 96.8% |
| Immigrants | Thailand | 0.0 /100 | #286 | Tragic 96.8% |
| Houma | 0.0 /100 | #287 | Tragic 96.8% |
| Immigrants | Afghanistan | 0.0 /100 | #288 | Tragic 96.8% |
| Immigrants | West Indies | 0.0 /100 | #289 | Tragic 96.7% |
| British West Indians | 0.0 /100 | #290 | Tragic 96.7% |
| Immigrants | Grenada | 0.0 /100 | #291 | Tragic 96.7% |
| Malaysians | 0.0 /100 | #292 | Tragic 96.7% |
| Puerto Ricans | 0.0 /100 | #293 | Tragic 96.7% |
| Immigrants | Eritrea | 0.0 /100 | #294 | Tragic 96.7% |
Demographics Similar to Yugoslavians by 4th Grade
In terms of 4th grade, the demographic groups most similar to Yugoslavians are Turkish (97.9%, a difference of 0.0%), Cree (97.9%, a difference of 0.0%), Cheyenne (97.9%, a difference of 0.010%), South African (97.9%, a difference of 0.010%), and Choctaw (97.9%, a difference of 0.010%).
| Demographics | Rating | Rank | 4th Grade |
| Immigrants | Ireland | 98.7 /100 | #93 | Exceptional 97.9% |
| Shoshone | 98.7 /100 | #94 | Exceptional 97.9% |
| Immigrants | Germany | 98.5 /100 | #95 | Exceptional 97.9% |
| Romanians | 98.4 /100 | #96 | Exceptional 97.9% |
| Cheyenne | 98.4 /100 | #97 | Exceptional 97.9% |
| South Africans | 98.2 /100 | #98 | Exceptional 97.9% |
| Turks | 98.2 /100 | #99 | Exceptional 97.9% |
| Yugoslavians | 98.1 /100 | #100 | Exceptional 97.9% |
| Cree | 98.1 /100 | #101 | Exceptional 97.9% |
| Choctaw | 97.9 /100 | #102 | Exceptional 97.9% |
| Puget Sound Salish | 97.7 /100 | #103 | Exceptional 97.9% |
| Immigrants | Nonimmigrants | 97.5 /100 | #104 | Exceptional 97.9% |
| German Russians | 97.5 /100 | #105 | Exceptional 97.9% |
| Immigrants | Czechoslovakia | 97.5 /100 | #106 | Exceptional 97.9% |
| Bhutanese | 97.4 /100 | #107 | Exceptional 97.9% |