Houma vs Tohono O'odham No Schooling Completed
COMPARE
Houma
Tohono O'odham
No Schooling Completed
No Schooling Completed Comparison
Houma
Tohono O'odham
2.8%
NO SCHOOLING COMPLETED
0.0/ 100
METRIC RATING
295th/ 347
METRIC RANK
2.3%
NO SCHOOLING COMPLETED
4.1/ 100
METRIC RATING
224th/ 347
METRIC RANK
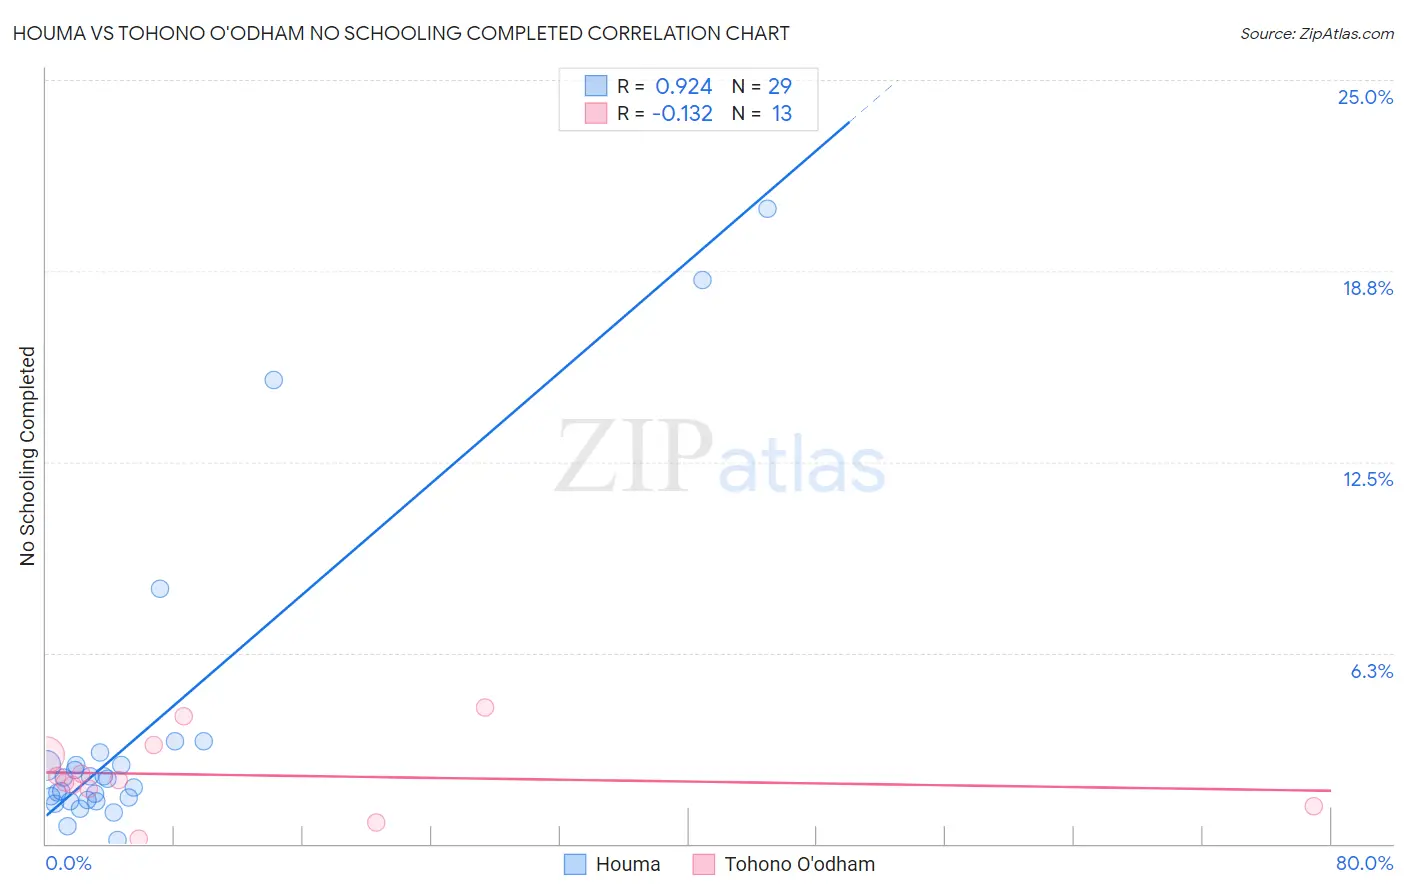
Houma vs Tohono O'odham No Schooling Completed Correlation Chart
The statistical analysis conducted on geographies consisting of 36,712,306 people shows a near-perfect positive correlation between the proportion of Houma and percentage of population with no schooling in the United States with a correlation coefficient (R) of 0.924 and weighted average of 2.8%. Similarly, the statistical analysis conducted on geographies consisting of 58,626,316 people shows a poor negative correlation between the proportion of Tohono O'odham and percentage of population with no schooling in the United States with a correlation coefficient (R) of -0.132 and weighted average of 2.3%, a difference of 20.5%.
No Schooling Completed Correlation Summary
| Measurement | Houma | Tohono O'odham |
| Minimum | 0.12% | 0.14% |
| Maximum | 20.8% | 4.5% |
| Range | 20.7% | 4.3% |
| Mean | 3.8% | 2.2% |
| Median | 2.1% | 2.1% |
| Interquartile 25% (IQ1) | 1.4% | 1.5% |
| Interquartile 75% (IQ3) | 2.8% | 3.1% |
| Interquartile Range (IQR) | 1.4% | 1.5% |
| Standard Deviation (Sample) | 5.2% | 1.2% |
| Standard Deviation (Population) | 5.1% | 1.2% |
Similar Demographics by No Schooling Completed
Demographics Similar to Houma by No Schooling Completed
In terms of no schooling completed, the demographic groups most similar to Houma are Immigrants (2.8%, a difference of 0.10%), Immigrants from Eritrea (2.8%, a difference of 0.52%), Malaysian (2.8%, a difference of 0.69%), Immigrants from Grenada (2.8%, a difference of 1.1%), and Immigrants from Cuba (2.8%, a difference of 1.3%).
| Demographics | Rating | Rank | No Schooling Completed |
| Immigrants | St. Vincent and the Grenadines | 0.0 /100 | #288 | Tragic 2.7% |
| Immigrants | Thailand | 0.0 /100 | #289 | Tragic 2.7% |
| Immigrants | Hong Kong | 0.0 /100 | #290 | Tragic 2.7% |
| British West Indians | 0.0 /100 | #291 | Tragic 2.7% |
| Immigrants | Grenada | 0.0 /100 | #292 | Tragic 2.8% |
| Malaysians | 0.0 /100 | #293 | Tragic 2.8% |
| Immigrants | Eritrea | 0.0 /100 | #294 | Tragic 2.8% |
| Houma | 0.0 /100 | #295 | Tragic 2.8% |
| Immigrants | Immigrants | 0.0 /100 | #296 | Tragic 2.8% |
| Immigrants | Cuba | 0.0 /100 | #297 | Tragic 2.8% |
| Immigrants | Dominica | 0.0 /100 | #298 | Tragic 2.8% |
| Central American Indians | 0.0 /100 | #299 | Tragic 2.8% |
| Haitians | 0.0 /100 | #300 | Tragic 2.9% |
| Immigrants | South Eastern Asia | 0.0 /100 | #301 | Tragic 2.9% |
| Immigrants | Caribbean | 0.0 /100 | #302 | Tragic 2.9% |
Demographics Similar to Tohono O'odham by No Schooling Completed
In terms of no schooling completed, the demographic groups most similar to Tohono O'odham are Sudanese (2.3%, a difference of 0.0%), Sierra Leonean (2.3%, a difference of 0.020%), Immigrants from Uganda (2.3%, a difference of 0.070%), Immigrants from Lebanon (2.3%, a difference of 0.29%), and U.S. Virgin Islander (2.3%, a difference of 0.36%).
| Demographics | Rating | Rank | No Schooling Completed |
| Immigrants | Syria | 6.6 /100 | #217 | Tragic 2.3% |
| Immigrants | Nepal | 6.4 /100 | #218 | Tragic 2.3% |
| Senegalese | 5.6 /100 | #219 | Tragic 2.3% |
| Immigrants | Costa Rica | 5.1 /100 | #220 | Tragic 2.3% |
| Immigrants | Sudan | 5.0 /100 | #221 | Tragic 2.3% |
| Sub-Saharan Africans | 4.7 /100 | #222 | Tragic 2.3% |
| Immigrants | Lebanon | 4.5 /100 | #223 | Tragic 2.3% |
| Tohono O'odham | 4.1 /100 | #224 | Tragic 2.3% |
| Sudanese | 4.1 /100 | #225 | Tragic 2.3% |
| Sierra Leoneans | 4.1 /100 | #226 | Tragic 2.3% |
| Immigrants | Uganda | 4.0 /100 | #227 | Tragic 2.3% |
| U.S. Virgin Islanders | 3.7 /100 | #228 | Tragic 2.3% |
| Immigrants | Pakistan | 3.6 /100 | #229 | Tragic 2.3% |
| Puerto Ricans | 3.4 /100 | #230 | Tragic 2.3% |
| Immigrants | Uruguay | 3.4 /100 | #231 | Tragic 2.3% |