Houma vs Soviet Union Unemployment Among Ages 20 to 24 years
COMPARE
Houma
Soviet Union
Unemployment Among Ages 20 to 24 years
Unemployment Among Ages 20 to 24 years Comparison
Houma
Soviet Union
12.6%
UNEMPLOYMENT AMONG AGES 20 TO 24 YEARS
0.0/ 100
METRIC RATING
312th/ 347
METRIC RANK
11.7%
UNEMPLOYMENT AMONG AGES 20 TO 24 YEARS
0.0/ 100
METRIC RATING
285th/ 347
METRIC RANK
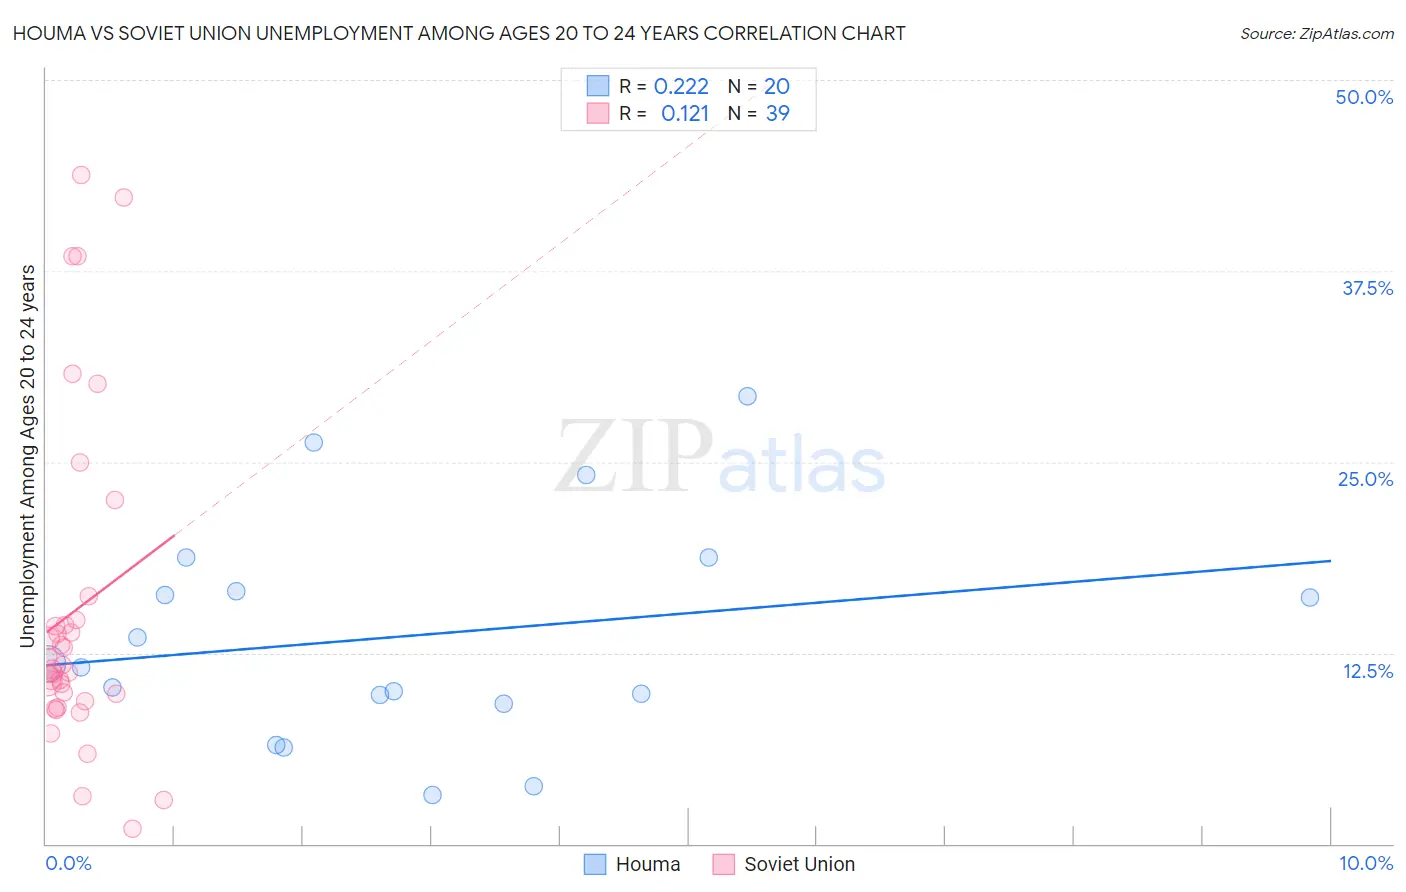
Houma vs Soviet Union Unemployment Among Ages 20 to 24 years Correlation Chart
The statistical analysis conducted on geographies consisting of 36,407,335 people shows a weak positive correlation between the proportion of Houma and unemployment rate among population between the ages 20 and 24 in the United States with a correlation coefficient (R) of 0.222 and weighted average of 12.6%. Similarly, the statistical analysis conducted on geographies consisting of 43,419,259 people shows a poor positive correlation between the proportion of Soviet Union and unemployment rate among population between the ages 20 and 24 in the United States with a correlation coefficient (R) of 0.121 and weighted average of 11.7%, a difference of 7.7%.
Unemployment Among Ages 20 to 24 years Correlation Summary
| Measurement | Houma | Soviet Union |
| Minimum | 3.2% | 1.0% |
| Maximum | 29.3% | 43.8% |
| Range | 26.1% | 42.8% |
| Mean | 13.6% | 15.2% |
| Median | 11.6% | 11.4% |
| Interquartile 25% (IQ1) | 9.5% | 9.3% |
| Interquartile 75% (IQ3) | 17.6% | 14.7% |
| Interquartile Range (IQR) | 8.2% | 5.4% |
| Standard Deviation (Sample) | 7.2% | 10.7% |
| Standard Deviation (Population) | 7.0% | 10.6% |
Similar Demographics by Unemployment Among Ages 20 to 24 years
Demographics Similar to Houma by Unemployment Among Ages 20 to 24 years
In terms of unemployment among ages 20 to 24 years, the demographic groups most similar to Houma are Vietnamese (12.6%, a difference of 0.15%), Shoshone (12.7%, a difference of 0.53%), Jamaican (12.6%, a difference of 0.59%), Immigrants from Bangladesh (12.6%, a difference of 0.72%), and Black/African American (12.7%, a difference of 0.73%).
| Demographics | Rating | Rank | Unemployment Among Ages 20 to 24 years |
| Chippewa | 0.0 /100 | #305 | Tragic 12.3% |
| Immigrants | Haiti | 0.0 /100 | #306 | Tragic 12.4% |
| Bermudans | 0.0 /100 | #307 | Tragic 12.5% |
| Tohono O'odham | 0.0 /100 | #308 | Tragic 12.5% |
| Immigrants | Bangladesh | 0.0 /100 | #309 | Tragic 12.6% |
| Jamaicans | 0.0 /100 | #310 | Tragic 12.6% |
| Vietnamese | 0.0 /100 | #311 | Tragic 12.6% |
| Houma | 0.0 /100 | #312 | Tragic 12.6% |
| Shoshone | 0.0 /100 | #313 | Tragic 12.7% |
| Blacks/African Americans | 0.0 /100 | #314 | Tragic 12.7% |
| West Indians | 0.0 /100 | #315 | Tragic 12.8% |
| Immigrants | Dominica | 0.0 /100 | #316 | Tragic 12.8% |
| Immigrants | Trinidad and Tobago | 0.0 /100 | #317 | Tragic 12.8% |
| Barbadians | 0.0 /100 | #318 | Tragic 12.9% |
| Trinidadians and Tobagonians | 0.0 /100 | #319 | Tragic 12.9% |
Demographics Similar to Soviet Union by Unemployment Among Ages 20 to 24 years
In terms of unemployment among ages 20 to 24 years, the demographic groups most similar to Soviet Union are Immigrants from Western Africa (11.7%, a difference of 0.040%), Ghanaian (11.7%, a difference of 0.050%), Ecuadorian (11.8%, a difference of 0.12%), Immigrants from Ecuador (11.8%, a difference of 0.21%), and U.S. Virgin Islander (11.8%, a difference of 0.27%).
| Demographics | Rating | Rank | Unemployment Among Ages 20 to 24 years |
| Colville | 0.0 /100 | #278 | Tragic 11.6% |
| Bahamians | 0.0 /100 | #279 | Tragic 11.6% |
| Alaskan Athabascans | 0.0 /100 | #280 | Tragic 11.6% |
| Armenians | 0.0 /100 | #281 | Tragic 11.7% |
| Immigrants | Cameroon | 0.0 /100 | #282 | Tragic 11.7% |
| Ghanaians | 0.0 /100 | #283 | Tragic 11.7% |
| Immigrants | Western Africa | 0.0 /100 | #284 | Tragic 11.7% |
| Soviet Union | 0.0 /100 | #285 | Tragic 11.7% |
| Ecuadorians | 0.0 /100 | #286 | Tragic 11.8% |
| Immigrants | Ecuador | 0.0 /100 | #287 | Tragic 11.8% |
| U.S. Virgin Islanders | 0.0 /100 | #288 | Tragic 11.8% |
| Belizeans | 0.0 /100 | #289 | Tragic 11.8% |
| Immigrants | Caribbean | 0.0 /100 | #290 | Tragic 11.8% |
| Central American Indians | 0.0 /100 | #291 | Tragic 11.9% |
| Immigrants | Senegal | 0.0 /100 | #292 | Tragic 11.9% |