Houma vs Polish 9th Grade
COMPARE
Houma
Polish
9th Grade
9th Grade Comparison
Houma
Poles
92.3%
9TH GRADE
0.0/ 100
METRIC RATING
312th/ 347
METRIC RANK
96.7%
9TH GRADE
100.0/ 100
METRIC RATING
6th/ 347
METRIC RANK
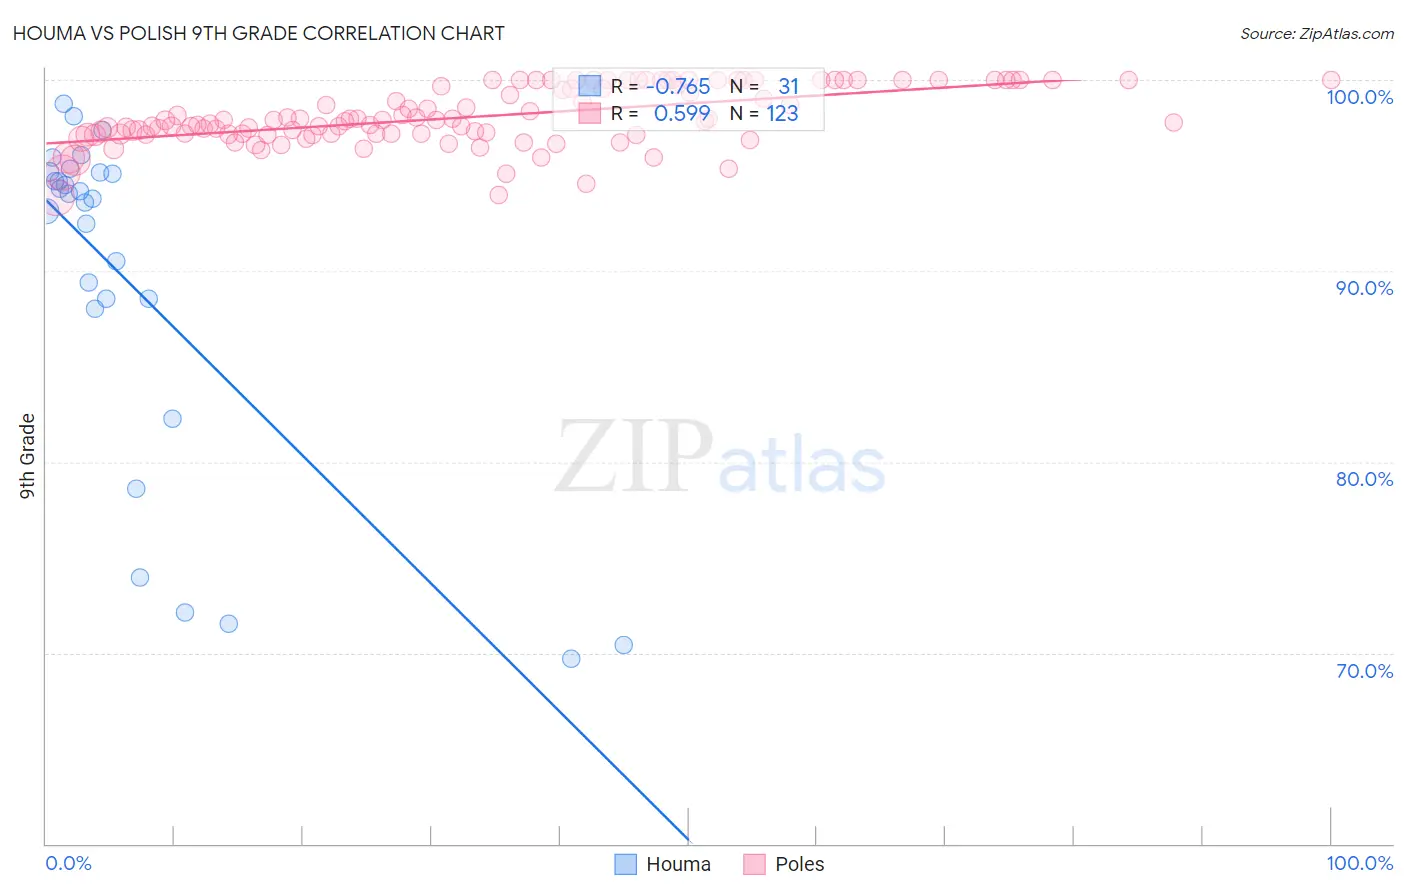
Houma vs Polish 9th Grade Correlation Chart
The statistical analysis conducted on geographies consisting of 36,795,916 people shows a strong negative correlation between the proportion of Houma and percentage of population with at least 9th grade education in the United States with a correlation coefficient (R) of -0.765 and weighted average of 92.3%. Similarly, the statistical analysis conducted on geographies consisting of 475,812,379 people shows a substantial positive correlation between the proportion of Poles and percentage of population with at least 9th grade education in the United States with a correlation coefficient (R) of 0.599 and weighted average of 96.7%, a difference of 4.8%.
9th Grade Correlation Summary
| Measurement | Houma | Polish |
| Minimum | 69.7% | 93.8% |
| Maximum | 98.8% | 100.0% |
| Range | 29.0% | 6.2% |
| Mean | 89.4% | 98.1% |
| Median | 93.8% | 97.8% |
| Interquartile 25% (IQ1) | 88.0% | 97.2% |
| Interquartile 75% (IQ3) | 95.1% | 100.0% |
| Interquartile Range (IQR) | 7.1% | 2.8% |
| Standard Deviation (Sample) | 9.0% | 1.5% |
| Standard Deviation (Population) | 8.9% | 1.5% |
Similar Demographics by 9th Grade
Demographics Similar to Houma by 9th Grade
In terms of 9th grade, the demographic groups most similar to Houma are Vietnamese (92.3%, a difference of 0.020%), Immigrants from Fiji (92.3%, a difference of 0.030%), Immigrants from Cambodia (92.4%, a difference of 0.060%), Immigrants from Portugal (92.2%, a difference of 0.060%), and Immigrants from Caribbean (92.2%, a difference of 0.070%).
| Demographics | Rating | Rank | 9th Grade |
| Japanese | 0.0 /100 | #305 | Tragic 92.6% |
| Immigrants | Vietnam | 0.0 /100 | #306 | Tragic 92.6% |
| Immigrants | Immigrants | 0.0 /100 | #307 | Tragic 92.5% |
| Immigrants | Guyana | 0.0 /100 | #308 | Tragic 92.5% |
| Immigrants | Bangladesh | 0.0 /100 | #309 | Tragic 92.4% |
| Immigrants | Cambodia | 0.0 /100 | #310 | Tragic 92.4% |
| Immigrants | Fiji | 0.0 /100 | #311 | Tragic 92.3% |
| Houma | 0.0 /100 | #312 | Tragic 92.3% |
| Vietnamese | 0.0 /100 | #313 | Tragic 92.3% |
| Immigrants | Portugal | 0.0 /100 | #314 | Tragic 92.2% |
| Immigrants | Caribbean | 0.0 /100 | #315 | Tragic 92.2% |
| Cape Verdeans | 0.0 /100 | #316 | Tragic 92.2% |
| Immigrants | Cuba | 0.0 /100 | #317 | Tragic 92.2% |
| Nepalese | 0.0 /100 | #318 | Tragic 92.0% |
| Ecuadorians | 0.0 /100 | #319 | Tragic 91.9% |
Demographics Similar to Poles by 9th Grade
In terms of 9th grade, the demographic groups most similar to Poles are Swedish (96.7%, a difference of 0.010%), Carpatho Rusyn (96.7%, a difference of 0.010%), Slovene (96.7%, a difference of 0.020%), German (96.7%, a difference of 0.020%), and Tlingit-Haida (96.6%, a difference of 0.10%).
| Demographics | Rating | Rank | 9th Grade |
| Tsimshian | 100.0 /100 | #1 | Exceptional 97.0% |
| Norwegians | 100.0 /100 | #2 | Exceptional 96.9% |
| Slovaks | 100.0 /100 | #3 | Exceptional 96.9% |
| Slovenes | 100.0 /100 | #4 | Exceptional 96.7% |
| Swedes | 100.0 /100 | #5 | Exceptional 96.7% |
| Poles | 100.0 /100 | #6 | Exceptional 96.7% |
| Carpatho Rusyns | 100.0 /100 | #7 | Exceptional 96.7% |
| Germans | 100.0 /100 | #8 | Exceptional 96.7% |
| Tlingit-Haida | 100.0 /100 | #9 | Exceptional 96.6% |
| Lithuanians | 100.0 /100 | #10 | Exceptional 96.6% |
| Finns | 100.0 /100 | #11 | Exceptional 96.6% |
| English | 100.0 /100 | #12 | Exceptional 96.6% |
| Danes | 100.0 /100 | #13 | Exceptional 96.5% |
| Scottish | 100.0 /100 | #14 | Exceptional 96.5% |
| Irish | 100.0 /100 | #15 | Exceptional 96.5% |