African vs Jamaican 9th Grade
COMPARE
African
Jamaican
9th Grade
9th Grade Comparison
Africans
Jamaicans
94.5%
9TH GRADE
9.0/ 100
METRIC RATING
219th/ 347
METRIC RANK
94.1%
9TH GRADE
1.0/ 100
METRIC RATING
251st/ 347
METRIC RANK
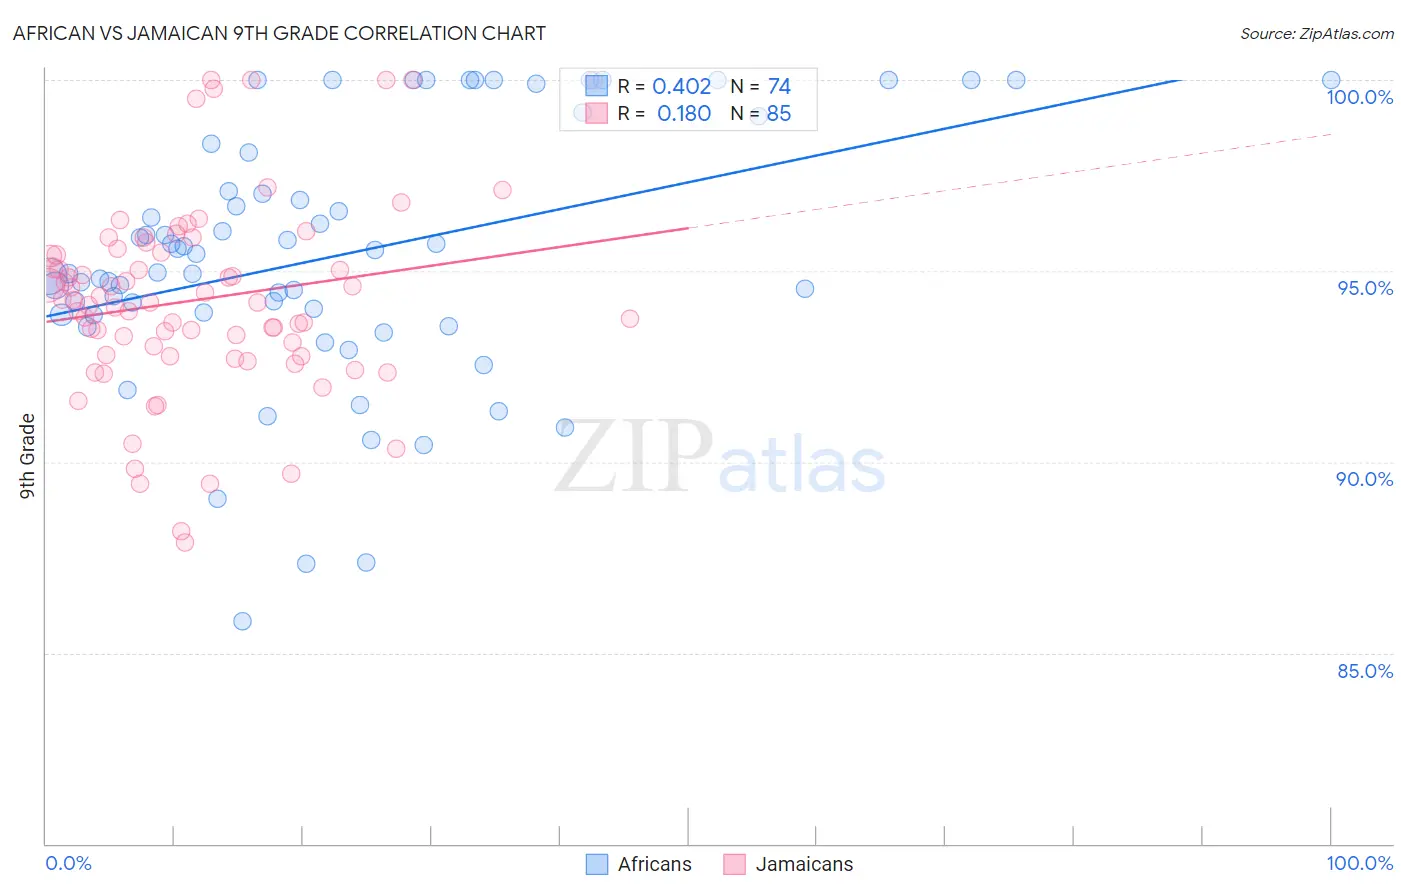
African vs Jamaican 9th Grade Correlation Chart
The statistical analysis conducted on geographies consisting of 470,094,658 people shows a moderate positive correlation between the proportion of Africans and percentage of population with at least 9th grade education in the United States with a correlation coefficient (R) of 0.402 and weighted average of 94.5%. Similarly, the statistical analysis conducted on geographies consisting of 368,084,732 people shows a poor positive correlation between the proportion of Jamaicans and percentage of population with at least 9th grade education in the United States with a correlation coefficient (R) of 0.180 and weighted average of 94.1%, a difference of 0.43%.
9th Grade Correlation Summary
| Measurement | African | Jamaican |
| Minimum | 85.8% | 87.9% |
| Maximum | 100.0% | 100.0% |
| Range | 14.2% | 12.1% |
| Mean | 95.4% | 94.2% |
| Median | 95.2% | 94.2% |
| Interquartile 25% (IQ1) | 93.9% | 92.8% |
| Interquartile 75% (IQ3) | 98.1% | 95.5% |
| Interquartile Range (IQR) | 4.2% | 2.8% |
| Standard Deviation (Sample) | 3.3% | 2.6% |
| Standard Deviation (Population) | 3.3% | 2.5% |
Similar Demographics by 9th Grade
Demographics Similar to Africans by 9th Grade
In terms of 9th grade, the demographic groups most similar to Africans are Portuguese (94.5%, a difference of 0.0%), Indian (Asian) (94.5%, a difference of 0.010%), Asian (94.5%, a difference of 0.020%), Immigrants from Eastern Africa (94.5%, a difference of 0.020%), and Immigrants from Asia (94.4%, a difference of 0.030%).
| Demographics | Rating | Rank | 9th Grade |
| Immigrants | Malaysia | 12.2 /100 | #212 | Poor 94.5% |
| Immigrants | Oceania | 12.1 /100 | #213 | Poor 94.5% |
| Immigrants | Liberia | 11.8 /100 | #214 | Poor 94.5% |
| Immigrants | Syria | 11.0 /100 | #215 | Poor 94.5% |
| Immigrants | Western Asia | 10.7 /100 | #216 | Poor 94.5% |
| Asians | 9.9 /100 | #217 | Tragic 94.5% |
| Portuguese | 9.2 /100 | #218 | Tragic 94.5% |
| Africans | 9.0 /100 | #219 | Tragic 94.5% |
| Indians (Asian) | 8.6 /100 | #220 | Tragic 94.5% |
| Immigrants | Eastern Africa | 8.2 /100 | #221 | Tragic 94.5% |
| Immigrants | Asia | 7.7 /100 | #222 | Tragic 94.4% |
| Bahamians | 7.0 /100 | #223 | Tragic 94.4% |
| Tongans | 6.0 /100 | #224 | Tragic 94.4% |
| Ethiopians | 5.4 /100 | #225 | Tragic 94.4% |
| Sub-Saharan Africans | 5.4 /100 | #226 | Tragic 94.4% |
Demographics Similar to Jamaicans by 9th Grade
In terms of 9th grade, the demographic groups most similar to Jamaicans are Immigrants from Senegal (94.1%, a difference of 0.010%), Colombian (94.0%, a difference of 0.030%), Uruguayan (94.1%, a difference of 0.060%), Immigrants from Hong Kong (94.1%, a difference of 0.060%), and U.S. Virgin Islander (94.0%, a difference of 0.060%).
| Demographics | Rating | Rank | 9th Grade |
| Dutch West Indians | 2.0 /100 | #244 | Tragic 94.2% |
| Paiute | 1.9 /100 | #245 | Tragic 94.2% |
| Senegalese | 1.9 /100 | #246 | Tragic 94.2% |
| Afghans | 1.8 /100 | #247 | Tragic 94.2% |
| Immigrants | Somalia | 1.4 /100 | #248 | Tragic 94.1% |
| Uruguayans | 1.3 /100 | #249 | Tragic 94.1% |
| Immigrants | Hong Kong | 1.3 /100 | #250 | Tragic 94.1% |
| Jamaicans | 1.0 /100 | #251 | Tragic 94.1% |
| Immigrants | Senegal | 0.9 /100 | #252 | Tragic 94.1% |
| Colombians | 0.8 /100 | #253 | Tragic 94.0% |
| U.S. Virgin Islanders | 0.7 /100 | #254 | Tragic 94.0% |
| Immigrants | Nigeria | 0.6 /100 | #255 | Tragic 94.0% |
| Immigrants | Afghanistan | 0.5 /100 | #256 | Tragic 94.0% |
| Immigrants | Costa Rica | 0.5 /100 | #257 | Tragic 94.0% |
| Immigrants | Thailand | 0.5 /100 | #258 | Tragic 93.9% |