Immigrants from Northern Africa vs Jamaican 9th Grade
COMPARE
Immigrants from Northern Africa
Jamaican
9th Grade
9th Grade Comparison
Immigrants from Northern Africa
Jamaicans
94.7%
9TH GRADE
30.7/ 100
METRIC RATING
192nd/ 347
METRIC RANK
94.1%
9TH GRADE
1.0/ 100
METRIC RATING
251st/ 347
METRIC RANK
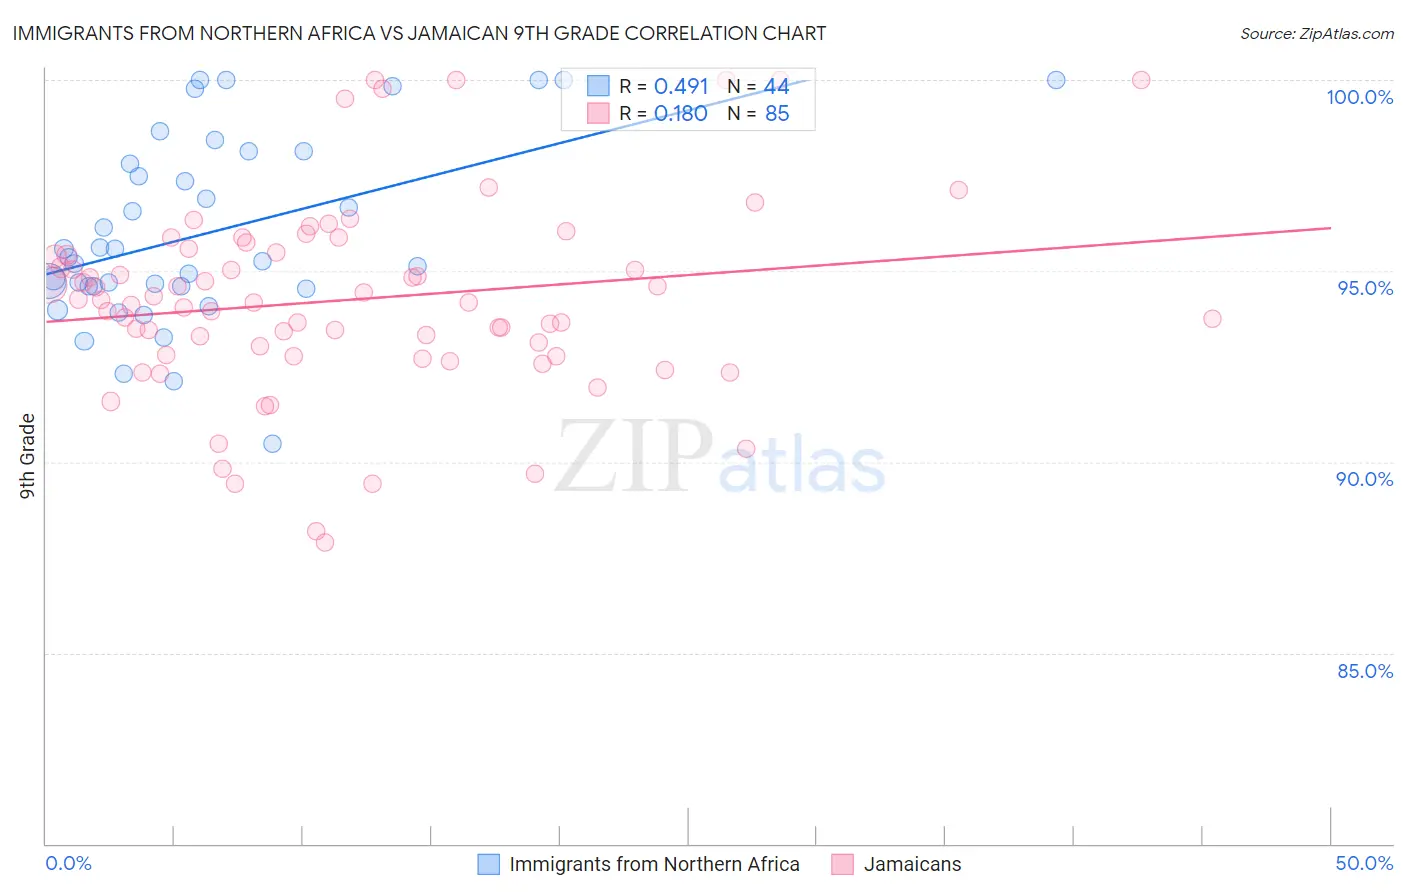
Immigrants from Northern Africa vs Jamaican 9th Grade Correlation Chart
The statistical analysis conducted on geographies consisting of 321,196,768 people shows a moderate positive correlation between the proportion of Immigrants from Northern Africa and percentage of population with at least 9th grade education in the United States with a correlation coefficient (R) of 0.491 and weighted average of 94.7%. Similarly, the statistical analysis conducted on geographies consisting of 368,084,732 people shows a poor positive correlation between the proportion of Jamaicans and percentage of population with at least 9th grade education in the United States with a correlation coefficient (R) of 0.180 and weighted average of 94.1%, a difference of 0.70%.
9th Grade Correlation Summary
| Measurement | Immigrants from Northern Africa | Jamaican |
| Minimum | 90.5% | 87.9% |
| Maximum | 100.0% | 100.0% |
| Range | 9.5% | 12.1% |
| Mean | 96.0% | 94.2% |
| Median | 95.3% | 94.2% |
| Interquartile 25% (IQ1) | 94.6% | 92.8% |
| Interquartile 75% (IQ3) | 98.0% | 95.5% |
| Interquartile Range (IQR) | 3.4% | 2.8% |
| Standard Deviation (Sample) | 2.4% | 2.6% |
| Standard Deviation (Population) | 2.4% | 2.5% |
Similar Demographics by 9th Grade
Demographics Similar to Immigrants from Northern Africa by 9th Grade
In terms of 9th grade, the demographic groups most similar to Immigrants from Northern Africa are Assyrian/Chaldean/Syriac (94.7%, a difference of 0.010%), Paraguayan (94.7%, a difference of 0.010%), Panamanian (94.7%, a difference of 0.010%), Sudanese (94.7%, a difference of 0.020%), and Marshallese (94.7%, a difference of 0.020%).
| Demographics | Rating | Rank | 9th Grade |
| Liberians | 37.4 /100 | #185 | Fair 94.8% |
| Hopi | 37.1 /100 | #186 | Fair 94.8% |
| Guamanians/Chamorros | 35.5 /100 | #187 | Fair 94.8% |
| Immigrants | Albania | 34.5 /100 | #188 | Fair 94.8% |
| Immigrants | Argentina | 34.4 /100 | #189 | Fair 94.8% |
| Sudanese | 32.7 /100 | #190 | Fair 94.7% |
| Assyrians/Chaldeans/Syriacs | 32.0 /100 | #191 | Fair 94.7% |
| Immigrants | Northern Africa | 30.7 /100 | #192 | Fair 94.7% |
| Paraguayans | 30.1 /100 | #193 | Fair 94.7% |
| Panamanians | 29.0 /100 | #194 | Fair 94.7% |
| Marshallese | 27.9 /100 | #195 | Fair 94.7% |
| Immigrants | Lebanon | 27.2 /100 | #196 | Fair 94.7% |
| Immigrants | Micronesia | 24.7 /100 | #197 | Fair 94.7% |
| Hawaiians | 22.7 /100 | #198 | Fair 94.7% |
| Laotians | 21.0 /100 | #199 | Fair 94.6% |
Demographics Similar to Jamaicans by 9th Grade
In terms of 9th grade, the demographic groups most similar to Jamaicans are Immigrants from Senegal (94.1%, a difference of 0.010%), Colombian (94.0%, a difference of 0.030%), Uruguayan (94.1%, a difference of 0.060%), Immigrants from Hong Kong (94.1%, a difference of 0.060%), and U.S. Virgin Islander (94.0%, a difference of 0.060%).
| Demographics | Rating | Rank | 9th Grade |
| Dutch West Indians | 2.0 /100 | #244 | Tragic 94.2% |
| Paiute | 1.9 /100 | #245 | Tragic 94.2% |
| Senegalese | 1.9 /100 | #246 | Tragic 94.2% |
| Afghans | 1.8 /100 | #247 | Tragic 94.2% |
| Immigrants | Somalia | 1.4 /100 | #248 | Tragic 94.1% |
| Uruguayans | 1.3 /100 | #249 | Tragic 94.1% |
| Immigrants | Hong Kong | 1.3 /100 | #250 | Tragic 94.1% |
| Jamaicans | 1.0 /100 | #251 | Tragic 94.1% |
| Immigrants | Senegal | 0.9 /100 | #252 | Tragic 94.1% |
| Colombians | 0.8 /100 | #253 | Tragic 94.0% |
| U.S. Virgin Islanders | 0.7 /100 | #254 | Tragic 94.0% |
| Immigrants | Nigeria | 0.6 /100 | #255 | Tragic 94.0% |
| Immigrants | Afghanistan | 0.5 /100 | #256 | Tragic 94.0% |
| Immigrants | Costa Rica | 0.5 /100 | #257 | Tragic 94.0% |
| Immigrants | Thailand | 0.5 /100 | #258 | Tragic 93.9% |