Houma vs Immigrants from Saudi Arabia 9th Grade
COMPARE
Houma
Immigrants from Saudi Arabia
9th Grade
9th Grade Comparison
Houma
Immigrants from Saudi Arabia
92.3%
9TH GRADE
0.0/ 100
METRIC RATING
312th/ 347
METRIC RANK
95.6%
9TH GRADE
98.8/ 100
METRIC RATING
92nd/ 347
METRIC RANK
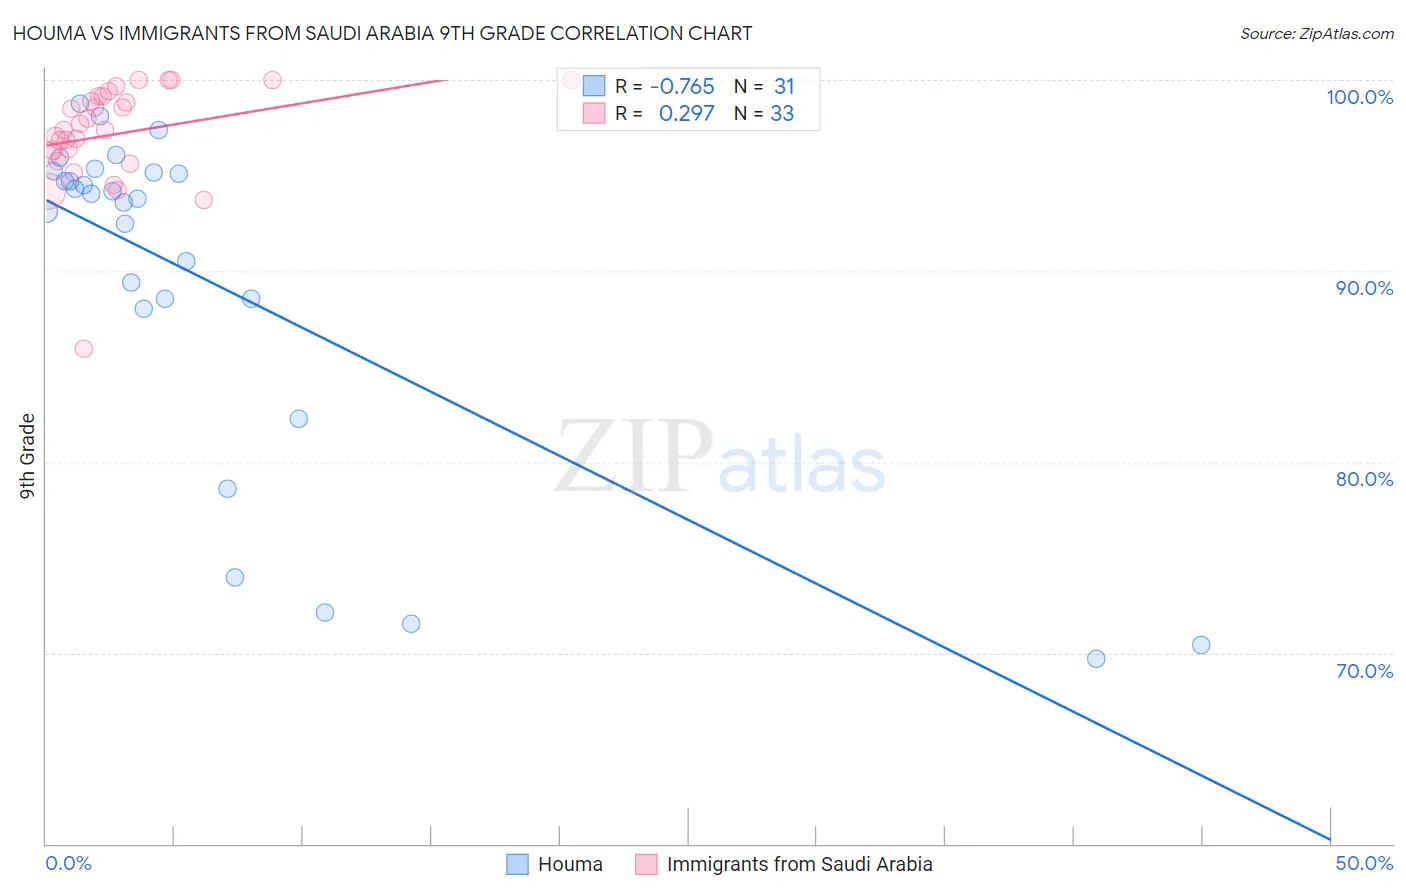
Houma vs Immigrants from Saudi Arabia 9th Grade Correlation Chart
The statistical analysis conducted on geographies consisting of 36,795,916 people shows a strong negative correlation between the proportion of Houma and percentage of population with at least 9th grade education in the United States with a correlation coefficient (R) of -0.765 and weighted average of 92.3%. Similarly, the statistical analysis conducted on geographies consisting of 164,277,573 people shows a weak positive correlation between the proportion of Immigrants from Saudi Arabia and percentage of population with at least 9th grade education in the United States with a correlation coefficient (R) of 0.297 and weighted average of 95.6%, a difference of 3.6%.
9th Grade Correlation Summary
| Measurement | Houma | Immigrants from Saudi Arabia |
| Minimum | 69.7% | 85.9% |
| Maximum | 98.8% | 100.0% |
| Range | 29.0% | 14.1% |
| Mean | 89.4% | 97.2% |
| Median | 93.8% | 97.4% |
| Interquartile 25% (IQ1) | 88.0% | 96.0% |
| Interquartile 75% (IQ3) | 95.1% | 99.1% |
| Interquartile Range (IQR) | 7.1% | 3.2% |
| Standard Deviation (Sample) | 9.0% | 2.8% |
| Standard Deviation (Population) | 8.9% | 2.7% |
Similar Demographics by 9th Grade
Demographics Similar to Houma by 9th Grade
In terms of 9th grade, the demographic groups most similar to Houma are Vietnamese (92.3%, a difference of 0.020%), Immigrants from Fiji (92.3%, a difference of 0.030%), Immigrants from Cambodia (92.4%, a difference of 0.060%), Immigrants from Portugal (92.2%, a difference of 0.060%), and Immigrants from Caribbean (92.2%, a difference of 0.070%).
| Demographics | Rating | Rank | 9th Grade |
| Japanese | 0.0 /100 | #305 | Tragic 92.6% |
| Immigrants | Vietnam | 0.0 /100 | #306 | Tragic 92.6% |
| Immigrants | Immigrants | 0.0 /100 | #307 | Tragic 92.5% |
| Immigrants | Guyana | 0.0 /100 | #308 | Tragic 92.5% |
| Immigrants | Bangladesh | 0.0 /100 | #309 | Tragic 92.4% |
| Immigrants | Cambodia | 0.0 /100 | #310 | Tragic 92.4% |
| Immigrants | Fiji | 0.0 /100 | #311 | Tragic 92.3% |
| Houma | 0.0 /100 | #312 | Tragic 92.3% |
| Vietnamese | 0.0 /100 | #313 | Tragic 92.3% |
| Immigrants | Portugal | 0.0 /100 | #314 | Tragic 92.2% |
| Immigrants | Caribbean | 0.0 /100 | #315 | Tragic 92.2% |
| Cape Verdeans | 0.0 /100 | #316 | Tragic 92.2% |
| Immigrants | Cuba | 0.0 /100 | #317 | Tragic 92.2% |
| Nepalese | 0.0 /100 | #318 | Tragic 92.0% |
| Ecuadorians | 0.0 /100 | #319 | Tragic 91.9% |
Demographics Similar to Immigrants from Saudi Arabia by 9th Grade
In terms of 9th grade, the demographic groups most similar to Immigrants from Saudi Arabia are Creek (95.6%, a difference of 0.0%), South African (95.6%, a difference of 0.010%), Immigrants from Germany (95.6%, a difference of 0.010%), Immigrants from Latvia (95.6%, a difference of 0.010%), and Immigrants from Czechoslovakia (95.7%, a difference of 0.020%).
| Demographics | Rating | Rank | 9th Grade |
| Icelanders | 99.1 /100 | #85 | Exceptional 95.7% |
| Immigrants | Western Europe | 99.1 /100 | #86 | Exceptional 95.7% |
| Okinawans | 99.0 /100 | #87 | Exceptional 95.7% |
| Immigrants | Czechoslovakia | 98.9 /100 | #88 | Exceptional 95.7% |
| Yugoslavians | 98.9 /100 | #89 | Exceptional 95.7% |
| South Africans | 98.8 /100 | #90 | Exceptional 95.6% |
| Creek | 98.8 /100 | #91 | Exceptional 95.6% |
| Immigrants | Saudi Arabia | 98.8 /100 | #92 | Exceptional 95.6% |
| Immigrants | Germany | 98.7 /100 | #93 | Exceptional 95.6% |
| Immigrants | Latvia | 98.7 /100 | #94 | Exceptional 95.6% |
| Americans | 98.5 /100 | #95 | Exceptional 95.6% |
| Filipinos | 98.5 /100 | #96 | Exceptional 95.6% |
| Delaware | 98.4 /100 | #97 | Exceptional 95.6% |
| Immigrants | Japan | 98.4 /100 | #98 | Exceptional 95.6% |
| Menominee | 98.3 /100 | #99 | Exceptional 95.6% |