Houma vs Salvadoran 9th Grade
COMPARE
Houma
Salvadoran
9th Grade
9th Grade Comparison
Houma
Salvadorans
92.3%
9TH GRADE
0.0/ 100
METRIC RATING
312th/ 347
METRIC RANK
89.6%
9TH GRADE
0.0/ 100
METRIC RATING
342nd/ 347
METRIC RANK
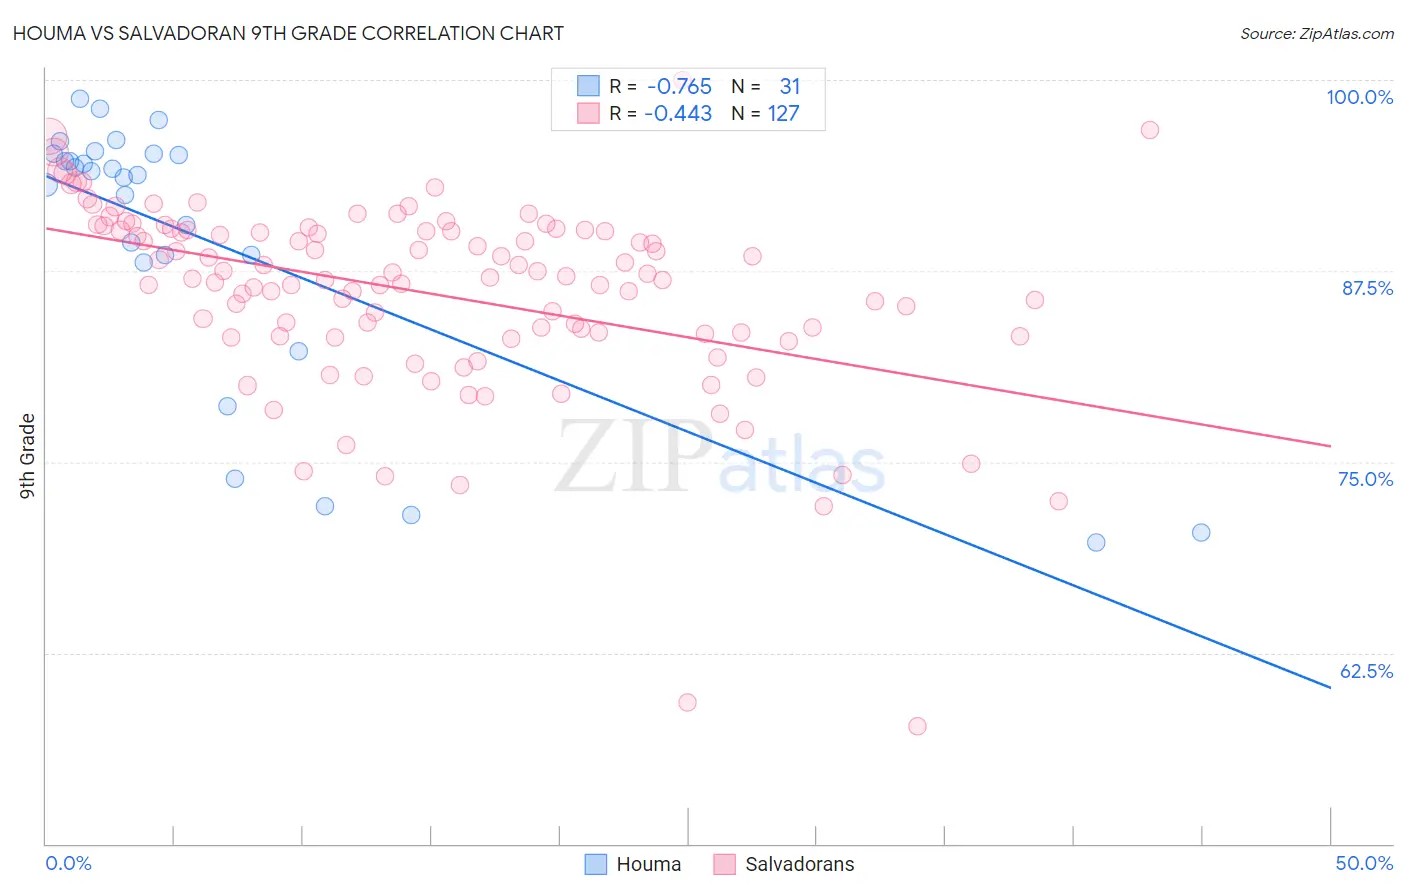
Houma vs Salvadoran 9th Grade Correlation Chart
The statistical analysis conducted on geographies consisting of 36,795,916 people shows a strong negative correlation between the proportion of Houma and percentage of population with at least 9th grade education in the United States with a correlation coefficient (R) of -0.765 and weighted average of 92.3%. Similarly, the statistical analysis conducted on geographies consisting of 399,034,410 people shows a moderate negative correlation between the proportion of Salvadorans and percentage of population with at least 9th grade education in the United States with a correlation coefficient (R) of -0.443 and weighted average of 89.6%, a difference of 3.0%.
9th Grade Correlation Summary
| Measurement | Houma | Salvadoran |
| Minimum | 69.7% | 57.7% |
| Maximum | 98.8% | 100.0% |
| Range | 29.0% | 42.3% |
| Mean | 89.4% | 86.0% |
| Median | 93.8% | 87.0% |
| Interquartile 25% (IQ1) | 88.0% | 83.2% |
| Interquartile 75% (IQ3) | 95.1% | 90.2% |
| Interquartile Range (IQR) | 7.1% | 7.0% |
| Standard Deviation (Sample) | 9.0% | 6.4% |
| Standard Deviation (Population) | 8.9% | 6.3% |
Similar Demographics by 9th Grade
Demographics Similar to Houma by 9th Grade
In terms of 9th grade, the demographic groups most similar to Houma are Vietnamese (92.3%, a difference of 0.020%), Immigrants from Fiji (92.3%, a difference of 0.030%), Immigrants from Cambodia (92.4%, a difference of 0.060%), Immigrants from Portugal (92.2%, a difference of 0.060%), and Immigrants from Caribbean (92.2%, a difference of 0.070%).
| Demographics | Rating | Rank | 9th Grade |
| Japanese | 0.0 /100 | #305 | Tragic 92.6% |
| Immigrants | Vietnam | 0.0 /100 | #306 | Tragic 92.6% |
| Immigrants | Immigrants | 0.0 /100 | #307 | Tragic 92.5% |
| Immigrants | Guyana | 0.0 /100 | #308 | Tragic 92.5% |
| Immigrants | Bangladesh | 0.0 /100 | #309 | Tragic 92.4% |
| Immigrants | Cambodia | 0.0 /100 | #310 | Tragic 92.4% |
| Immigrants | Fiji | 0.0 /100 | #311 | Tragic 92.3% |
| Houma | 0.0 /100 | #312 | Tragic 92.3% |
| Vietnamese | 0.0 /100 | #313 | Tragic 92.3% |
| Immigrants | Portugal | 0.0 /100 | #314 | Tragic 92.2% |
| Immigrants | Caribbean | 0.0 /100 | #315 | Tragic 92.2% |
| Cape Verdeans | 0.0 /100 | #316 | Tragic 92.2% |
| Immigrants | Cuba | 0.0 /100 | #317 | Tragic 92.2% |
| Nepalese | 0.0 /100 | #318 | Tragic 92.0% |
| Ecuadorians | 0.0 /100 | #319 | Tragic 91.9% |
Demographics Similar to Salvadorans by 9th Grade
In terms of 9th grade, the demographic groups most similar to Salvadorans are Immigrants from Guatemala (89.4%, a difference of 0.20%), Guatemalan (89.9%, a difference of 0.31%), Mexican (90.0%, a difference of 0.43%), Yakama (90.1%, a difference of 0.49%), and Immigrants from El Salvador (89.0%, a difference of 0.71%).
| Demographics | Rating | Rank | 9th Grade |
| Immigrants | Yemen | 0.0 /100 | #333 | Tragic 90.8% |
| Immigrants | Azores | 0.0 /100 | #334 | Tragic 90.8% |
| Immigrants | Honduras | 0.0 /100 | #335 | Tragic 90.6% |
| Immigrants | Dominican Republic | 0.0 /100 | #336 | Tragic 90.5% |
| Immigrants | Latin America | 0.0 /100 | #337 | Tragic 90.4% |
| Central Americans | 0.0 /100 | #338 | Tragic 90.4% |
| Yakama | 0.0 /100 | #339 | Tragic 90.1% |
| Mexicans | 0.0 /100 | #340 | Tragic 90.0% |
| Guatemalans | 0.0 /100 | #341 | Tragic 89.9% |
| Salvadorans | 0.0 /100 | #342 | Tragic 89.6% |
| Immigrants | Guatemala | 0.0 /100 | #343 | Tragic 89.4% |
| Immigrants | El Salvador | 0.0 /100 | #344 | Tragic 89.0% |
| Immigrants | Central America | 0.0 /100 | #345 | Tragic 89.0% |
| Immigrants | Mexico | 0.0 /100 | #346 | Tragic 88.7% |
| Spanish American Indians | 0.0 /100 | #347 | Tragic 88.3% |