Ugandan vs Jamaican 9th Grade
COMPARE
Ugandan
Jamaican
9th Grade
9th Grade Comparison
Ugandans
Jamaicans
95.1%
9TH GRADE
77.0/ 100
METRIC RATING
152nd/ 347
METRIC RANK
94.1%
9TH GRADE
1.0/ 100
METRIC RATING
251st/ 347
METRIC RANK
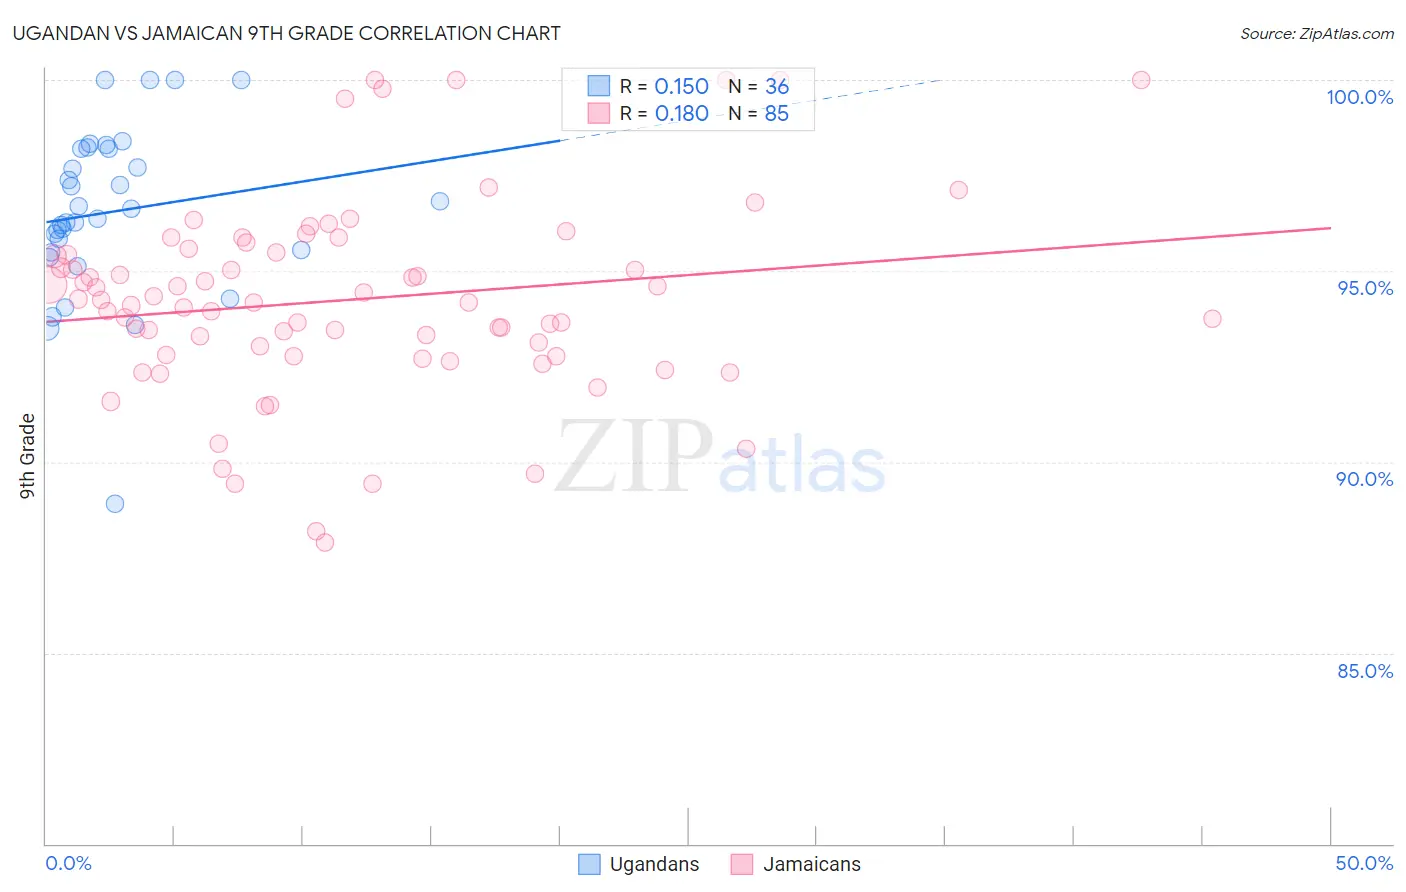
Ugandan vs Jamaican 9th Grade Correlation Chart
The statistical analysis conducted on geographies consisting of 93,991,892 people shows a poor positive correlation between the proportion of Ugandans and percentage of population with at least 9th grade education in the United States with a correlation coefficient (R) of 0.150 and weighted average of 95.1%. Similarly, the statistical analysis conducted on geographies consisting of 368,084,732 people shows a poor positive correlation between the proportion of Jamaicans and percentage of population with at least 9th grade education in the United States with a correlation coefficient (R) of 0.180 and weighted average of 94.1%, a difference of 1.1%.
9th Grade Correlation Summary
| Measurement | Ugandan | Jamaican |
| Minimum | 88.9% | 87.9% |
| Maximum | 100.0% | 100.0% |
| Range | 11.1% | 12.1% |
| Mean | 96.6% | 94.2% |
| Median | 96.5% | 94.2% |
| Interquartile 25% (IQ1) | 95.5% | 92.8% |
| Interquartile 75% (IQ3) | 98.2% | 95.5% |
| Interquartile Range (IQR) | 2.7% | 2.8% |
| Standard Deviation (Sample) | 2.2% | 2.6% |
| Standard Deviation (Population) | 2.2% | 2.5% |
Similar Demographics by 9th Grade
Demographics Similar to Ugandans by 9th Grade
In terms of 9th grade, the demographic groups most similar to Ugandans are Cajun (95.1%, a difference of 0.0%), Albanian (95.1%, a difference of 0.010%), Kenyan (95.1%, a difference of 0.020%), Arab (95.1%, a difference of 0.020%), and Immigrants from Kazakhstan (95.1%, a difference of 0.020%).
| Demographics | Rating | Rank | 9th Grade |
| Pueblo | 82.2 /100 | #145 | Excellent 95.1% |
| Immigrants | Sri Lanka | 82.1 /100 | #146 | Excellent 95.1% |
| Choctaw | 81.9 /100 | #147 | Excellent 95.1% |
| Immigrants | Jordan | 81.2 /100 | #148 | Excellent 95.1% |
| Immigrants | Korea | 79.6 /100 | #149 | Good 95.1% |
| Kenyans | 79.1 /100 | #150 | Good 95.1% |
| Cajuns | 77.3 /100 | #151 | Good 95.1% |
| Ugandans | 77.0 /100 | #152 | Good 95.1% |
| Albanians | 76.1 /100 | #153 | Good 95.1% |
| Arabs | 74.9 /100 | #154 | Good 95.1% |
| Immigrants | Kazakhstan | 74.7 /100 | #155 | Good 95.1% |
| Immigrants | Kenya | 73.1 /100 | #156 | Good 95.0% |
| Mongolians | 73.0 /100 | #157 | Good 95.0% |
| Egyptians | 70.1 /100 | #158 | Good 95.0% |
| Immigrants | Ukraine | 67.4 /100 | #159 | Good 95.0% |
Demographics Similar to Jamaicans by 9th Grade
In terms of 9th grade, the demographic groups most similar to Jamaicans are Immigrants from Senegal (94.1%, a difference of 0.010%), Colombian (94.0%, a difference of 0.030%), Uruguayan (94.1%, a difference of 0.060%), Immigrants from Hong Kong (94.1%, a difference of 0.060%), and U.S. Virgin Islander (94.0%, a difference of 0.060%).
| Demographics | Rating | Rank | 9th Grade |
| Dutch West Indians | 2.0 /100 | #244 | Tragic 94.2% |
| Paiute | 1.9 /100 | #245 | Tragic 94.2% |
| Senegalese | 1.9 /100 | #246 | Tragic 94.2% |
| Afghans | 1.8 /100 | #247 | Tragic 94.2% |
| Immigrants | Somalia | 1.4 /100 | #248 | Tragic 94.1% |
| Uruguayans | 1.3 /100 | #249 | Tragic 94.1% |
| Immigrants | Hong Kong | 1.3 /100 | #250 | Tragic 94.1% |
| Jamaicans | 1.0 /100 | #251 | Tragic 94.1% |
| Immigrants | Senegal | 0.9 /100 | #252 | Tragic 94.1% |
| Colombians | 0.8 /100 | #253 | Tragic 94.0% |
| U.S. Virgin Islanders | 0.7 /100 | #254 | Tragic 94.0% |
| Immigrants | Nigeria | 0.6 /100 | #255 | Tragic 94.0% |
| Immigrants | Afghanistan | 0.5 /100 | #256 | Tragic 94.0% |
| Immigrants | Costa Rica | 0.5 /100 | #257 | Tragic 94.0% |
| Immigrants | Thailand | 0.5 /100 | #258 | Tragic 93.9% |