Houma vs Italian College, Under 1 year
COMPARE
Houma
Italian
College, Under 1 year
College, Under 1 year Comparison
Houma
Italians
47.6%
COLLEGE, UNDER 1 YEAR
0.0/ 100
METRIC RATING
346th/ 347
METRIC RANK
67.2%
COLLEGE, UNDER 1 YEAR
91.8/ 100
METRIC RATING
125th/ 347
METRIC RANK
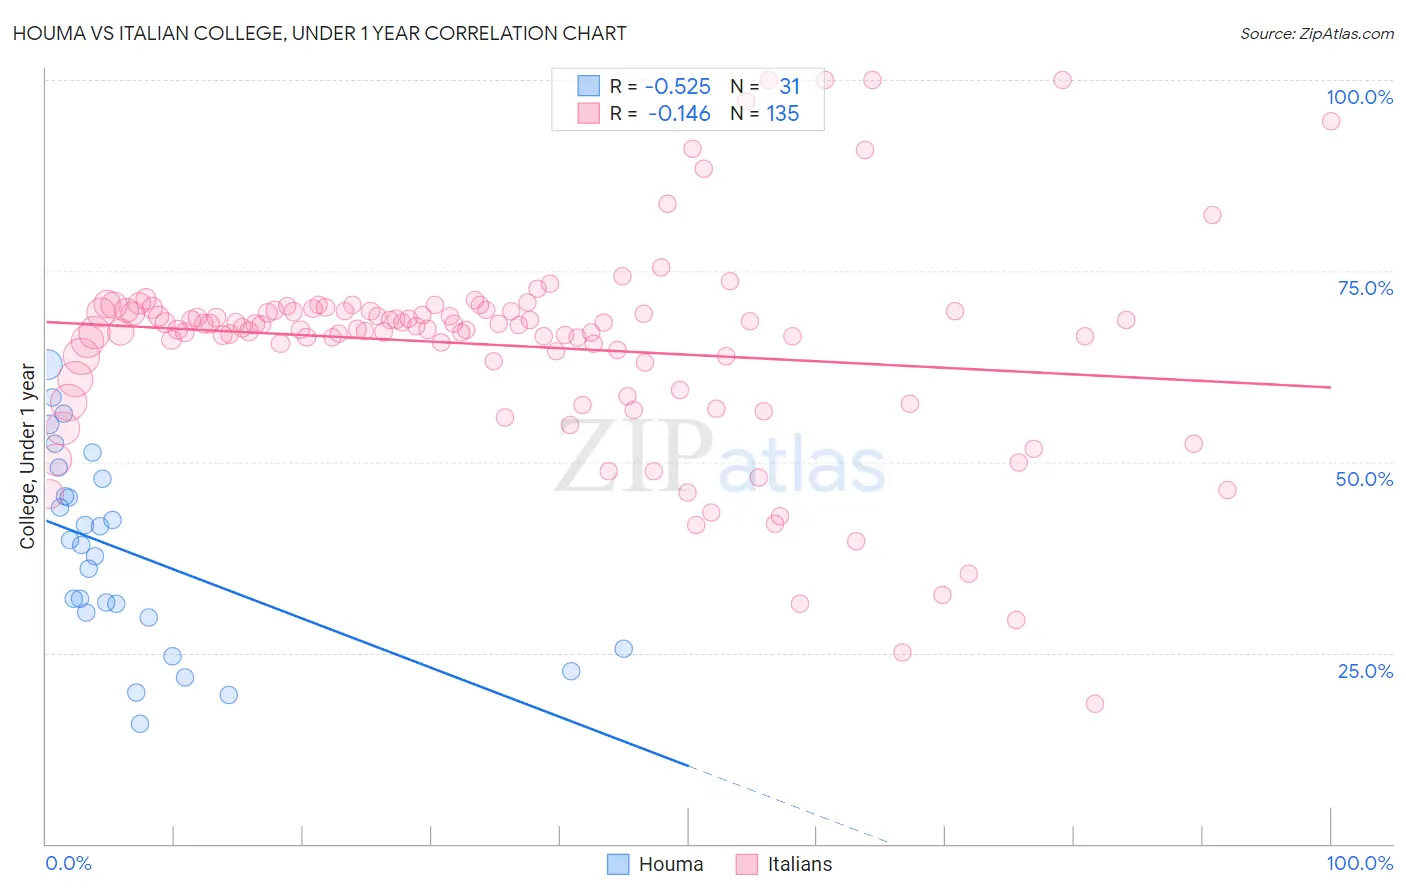
Houma vs Italian College, Under 1 year Correlation Chart
The statistical analysis conducted on geographies consisting of 36,795,916 people shows a substantial negative correlation between the proportion of Houma and percentage of population with at least college, under 1 year education in the United States with a correlation coefficient (R) of -0.525 and weighted average of 47.6%. Similarly, the statistical analysis conducted on geographies consisting of 575,108,036 people shows a poor negative correlation between the proportion of Italians and percentage of population with at least college, under 1 year education in the United States with a correlation coefficient (R) of -0.146 and weighted average of 67.2%, a difference of 40.9%.
College, Under 1 year Correlation Summary
| Measurement | Houma | Italian |
| Minimum | 15.6% | 18.4% |
| Maximum | 62.7% | 100.0% |
| Range | 47.1% | 81.6% |
| Mean | 38.1% | 65.2% |
| Median | 39.1% | 67.5% |
| Interquartile 25% (IQ1) | 29.7% | 63.1% |
| Interquartile 75% (IQ3) | 47.7% | 69.8% |
| Interquartile Range (IQR) | 18.1% | 6.7% |
| Standard Deviation (Sample) | 12.6% | 13.7% |
| Standard Deviation (Population) | 12.4% | 13.6% |
Similar Demographics by College, Under 1 year
Demographics Similar to Houma by College, Under 1 year
In terms of college, under 1 year, the demographic groups most similar to Houma are Yup'ik (45.8%, a difference of 4.1%), Pima (51.4%, a difference of 7.9%), Yakama (52.6%, a difference of 10.5%), Tohono O'odham (52.8%, a difference of 10.8%), and Immigrants from Mexico (53.7%, a difference of 12.6%).
| Demographics | Rating | Rank | College, Under 1 year |
| Yuman | 0.0 /100 | #333 | Tragic 55.1% |
| Immigrants | Azores | 0.0 /100 | #334 | Tragic 54.7% |
| Inupiat | 0.0 /100 | #335 | Tragic 54.6% |
| Pennsylvania Germans | 0.0 /100 | #336 | Tragic 54.5% |
| Immigrants | Central America | 0.0 /100 | #337 | Tragic 54.4% |
| Lumbee | 0.0 /100 | #338 | Tragic 54.2% |
| Immigrants | Dominican Republic | 0.0 /100 | #339 | Tragic 54.0% |
| Spanish American Indians | 0.0 /100 | #340 | Tragic 54.0% |
| Immigrants | Cabo Verde | 0.0 /100 | #341 | Tragic 53.7% |
| Immigrants | Mexico | 0.0 /100 | #342 | Tragic 53.7% |
| Tohono O'odham | 0.0 /100 | #343 | Tragic 52.8% |
| Yakama | 0.0 /100 | #344 | Tragic 52.6% |
| Pima | 0.0 /100 | #345 | Tragic 51.4% |
| Houma | 0.0 /100 | #346 | Tragic 47.6% |
| Yup'ik | 0.0 /100 | #347 | Tragic 45.8% |
Demographics Similar to Italians by College, Under 1 year
In terms of college, under 1 year, the demographic groups most similar to Italians are Alsatian (67.1%, a difference of 0.060%), Arab (67.2%, a difference of 0.12%), Immigrants from Northern Africa (67.2%, a difference of 0.13%), Czech (67.1%, a difference of 0.14%), and Immigrants from Jordan (67.3%, a difference of 0.15%).
| Demographics | Rating | Rank | College, Under 1 year |
| Immigrants | Ukraine | 94.7 /100 | #118 | Exceptional 67.5% |
| Lebanese | 94.6 /100 | #119 | Exceptional 67.5% |
| Serbians | 93.9 /100 | #120 | Exceptional 67.4% |
| Slovenes | 93.3 /100 | #121 | Exceptional 67.3% |
| Immigrants | Jordan | 92.8 /100 | #122 | Exceptional 67.3% |
| Immigrants | Northern Africa | 92.7 /100 | #123 | Exceptional 67.2% |
| Arabs | 92.6 /100 | #124 | Exceptional 67.2% |
| Italians | 91.8 /100 | #125 | Exceptional 67.2% |
| Alsatians | 91.3 /100 | #126 | Exceptional 67.1% |
| Czechs | 90.8 /100 | #127 | Exceptional 67.1% |
| Scottish | 90.2 /100 | #128 | Exceptional 67.0% |
| Immigrants | Eastern Africa | 89.5 /100 | #129 | Excellent 67.0% |
| Immigrants | Syria | 89.0 /100 | #130 | Excellent 66.9% |
| Finns | 88.6 /100 | #131 | Excellent 66.9% |
| Poles | 88.4 /100 | #132 | Excellent 66.9% |