Houma vs Italian Cognitive Disability
COMPARE
Houma
Italian
Cognitive Disability
Cognitive Disability Comparison
Houma
Italians
19.3%
COGNITIVE DISABILITY
0.0/ 100
METRIC RATING
342nd/ 347
METRIC RANK
16.4%
COGNITIVE DISABILITY
99.9/ 100
METRIC RATING
33rd/ 347
METRIC RANK
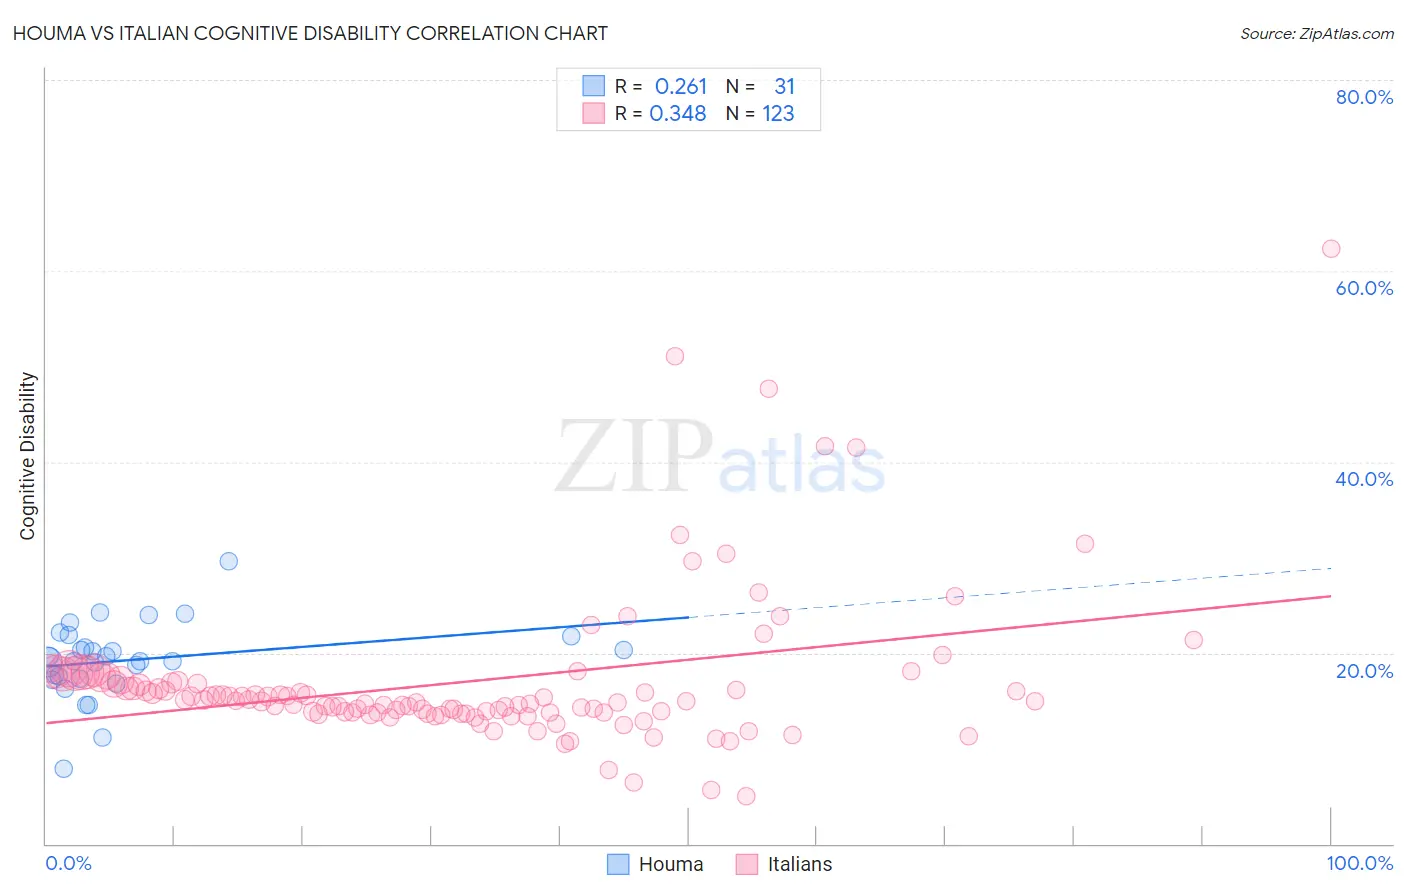
Houma vs Italian Cognitive Disability Correlation Chart
The statistical analysis conducted on geographies consisting of 36,799,095 people shows a weak positive correlation between the proportion of Houma and percentage of population with cognitive disability in the United States with a correlation coefficient (R) of 0.261 and weighted average of 19.3%. Similarly, the statistical analysis conducted on geographies consisting of 574,911,788 people shows a mild positive correlation between the proportion of Italians and percentage of population with cognitive disability in the United States with a correlation coefficient (R) of 0.348 and weighted average of 16.4%, a difference of 17.4%.
Cognitive Disability Correlation Summary
| Measurement | Houma | Italian |
| Minimum | 7.9% | 4.9% |
| Maximum | 29.6% | 62.3% |
| Range | 21.7% | 57.4% |
| Mean | 19.2% | 16.9% |
| Median | 19.2% | 15.0% |
| Interquartile 25% (IQ1) | 17.3% | 13.7% |
| Interquartile 75% (IQ3) | 21.8% | 17.1% |
| Interquartile Range (IQR) | 4.5% | 3.3% |
| Standard Deviation (Sample) | 4.0% | 8.0% |
| Standard Deviation (Population) | 4.0% | 8.0% |
Similar Demographics by Cognitive Disability
Demographics Similar to Houma by Cognitive Disability
In terms of cognitive disability, the demographic groups most similar to Houma are Tohono O'odham (19.3%, a difference of 0.0%), Cape Verdean (19.2%, a difference of 0.24%), Puerto Rican (19.2%, a difference of 0.26%), Immigrants from Zaire (19.4%, a difference of 0.69%), and Lumbee (19.1%, a difference of 0.74%).
| Demographics | Rating | Rank | Cognitive Disability |
| Immigrants | Yemen | 0.0 /100 | #333 | Tragic 18.8% |
| Sudanese | 0.0 /100 | #334 | Tragic 18.9% |
| Senegalese | 0.0 /100 | #335 | Tragic 19.0% |
| Blacks/African Americans | 0.0 /100 | #336 | Tragic 19.0% |
| Immigrants | Saudi Arabia | 0.0 /100 | #337 | Tragic 19.1% |
| Lumbee | 0.0 /100 | #338 | Tragic 19.1% |
| Puerto Ricans | 0.0 /100 | #339 | Tragic 19.2% |
| Cape Verdeans | 0.0 /100 | #340 | Tragic 19.2% |
| Tohono O'odham | 0.0 /100 | #341 | Tragic 19.3% |
| Houma | 0.0 /100 | #342 | Tragic 19.3% |
| Immigrants | Zaire | 0.0 /100 | #343 | Tragic 19.4% |
| Immigrants | Congo | 0.0 /100 | #344 | Tragic 19.7% |
| Somalis | 0.0 /100 | #345 | Tragic 19.8% |
| Immigrants | Cabo Verde | 0.0 /100 | #346 | Tragic 19.9% |
| Immigrants | Somalia | 0.0 /100 | #347 | Tragic 20.0% |
Demographics Similar to Italians by Cognitive Disability
In terms of cognitive disability, the demographic groups most similar to Italians are Russian (16.4%, a difference of 0.0%), Immigrants from Israel (16.4%, a difference of 0.070%), Slovak (16.4%, a difference of 0.080%), Greek (16.4%, a difference of 0.090%), and Immigrants from Romania (16.4%, a difference of 0.13%).
| Demographics | Rating | Rank | Cognitive Disability |
| Immigrants | Croatia | 99.9 /100 | #26 | Exceptional 16.4% |
| Immigrants | Pakistan | 99.9 /100 | #27 | Exceptional 16.4% |
| Poles | 99.9 /100 | #28 | Exceptional 16.4% |
| Filipinos | 99.9 /100 | #29 | Exceptional 16.4% |
| Czechs | 99.9 /100 | #30 | Exceptional 16.4% |
| Immigrants | Romania | 99.9 /100 | #31 | Exceptional 16.4% |
| Immigrants | Israel | 99.9 /100 | #32 | Exceptional 16.4% |
| Italians | 99.9 /100 | #33 | Exceptional 16.4% |
| Russians | 99.9 /100 | #34 | Exceptional 16.4% |
| Slovaks | 99.9 /100 | #35 | Exceptional 16.4% |
| Greeks | 99.9 /100 | #36 | Exceptional 16.4% |
| Slovenes | 99.9 /100 | #37 | Exceptional 16.5% |
| Immigrants | Eastern Europe | 99.9 /100 | #38 | Exceptional 16.5% |
| Bolivians | 99.9 /100 | #39 | Exceptional 16.5% |
| Immigrants | Belarus | 99.9 /100 | #40 | Exceptional 16.5% |