Asian vs Italian College, Under 1 year
COMPARE
Asian
Italian
College, Under 1 year
College, Under 1 year Comparison
Asians
Italians
69.4%
COLLEGE, UNDER 1 YEAR
99.6/ 100
METRIC RATING
57th/ 347
METRIC RANK
67.2%
COLLEGE, UNDER 1 YEAR
91.8/ 100
METRIC RATING
125th/ 347
METRIC RANK
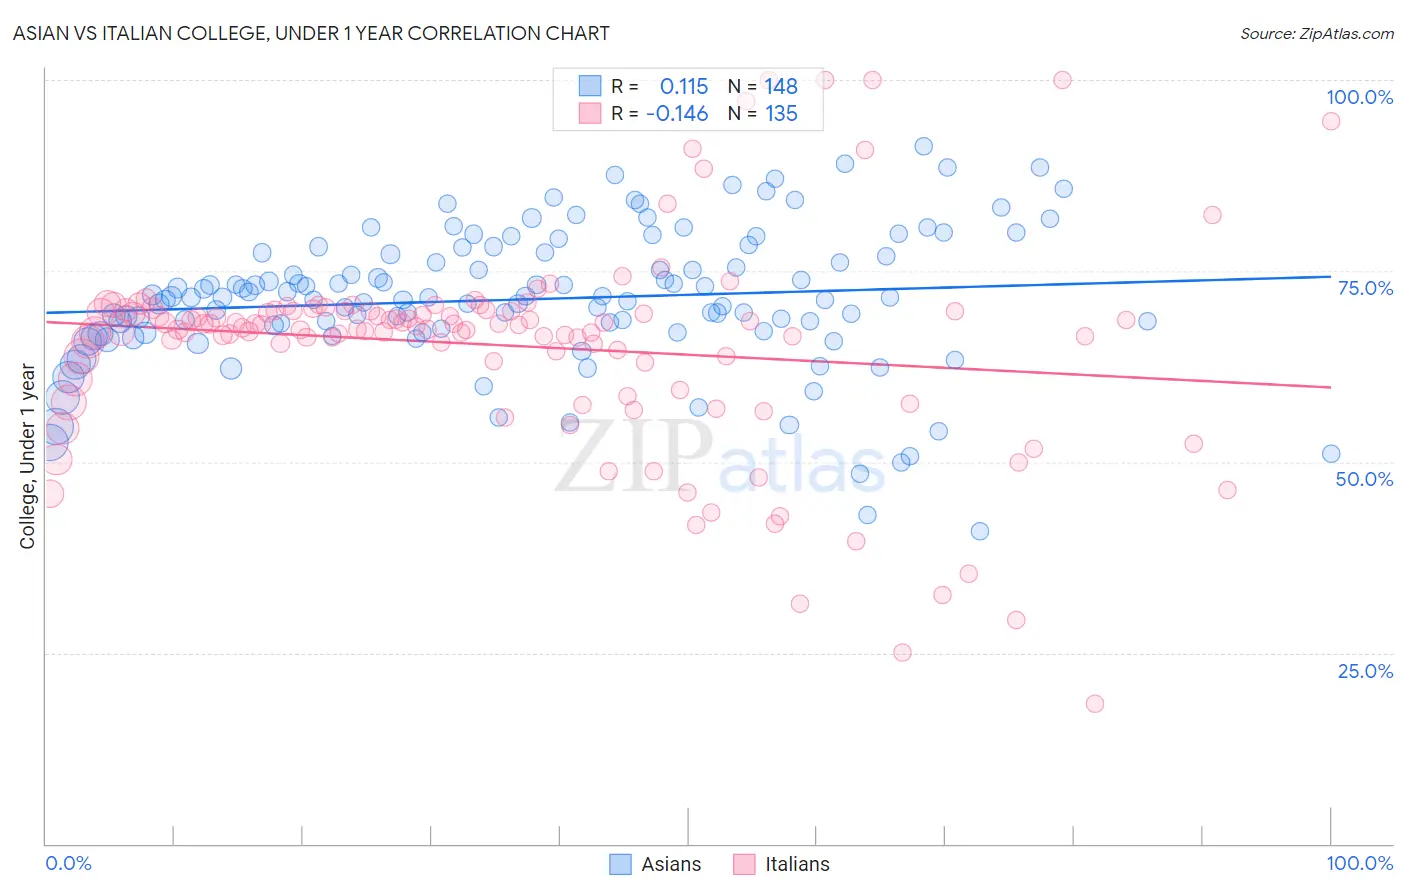
Asian vs Italian College, Under 1 year Correlation Chart
The statistical analysis conducted on geographies consisting of 550,912,370 people shows a poor positive correlation between the proportion of Asians and percentage of population with at least college, under 1 year education in the United States with a correlation coefficient (R) of 0.115 and weighted average of 69.4%. Similarly, the statistical analysis conducted on geographies consisting of 575,108,036 people shows a poor negative correlation between the proportion of Italians and percentage of population with at least college, under 1 year education in the United States with a correlation coefficient (R) of -0.146 and weighted average of 67.2%, a difference of 3.4%.
College, Under 1 year Correlation Summary
| Measurement | Asian | Italian |
| Minimum | 40.9% | 18.4% |
| Maximum | 91.3% | 100.0% |
| Range | 50.4% | 81.6% |
| Mean | 71.3% | 65.2% |
| Median | 71.5% | 67.5% |
| Interquartile 25% (IQ1) | 67.0% | 63.1% |
| Interquartile 75% (IQ3) | 77.3% | 69.8% |
| Interquartile Range (IQR) | 10.3% | 6.7% |
| Standard Deviation (Sample) | 9.2% | 13.7% |
| Standard Deviation (Population) | 9.1% | 13.6% |
Similar Demographics by College, Under 1 year
Demographics Similar to Asians by College, Under 1 year
In terms of college, under 1 year, the demographic groups most similar to Asians are Immigrants from Scotland (69.4%, a difference of 0.020%), Immigrants from Malaysia (69.3%, a difference of 0.10%), Maltese (69.5%, a difference of 0.14%), Immigrants from Serbia (69.3%, a difference of 0.23%), and Immigrants from Czechoslovakia (69.6%, a difference of 0.25%).
| Demographics | Rating | Rank | College, Under 1 year |
| Zimbabweans | 99.8 /100 | #50 | Exceptional 69.9% |
| Mongolians | 99.8 /100 | #51 | Exceptional 69.9% |
| Immigrants | Russia | 99.8 /100 | #52 | Exceptional 69.9% |
| South Africans | 99.7 /100 | #53 | Exceptional 69.7% |
| Immigrants | Czechoslovakia | 99.7 /100 | #54 | Exceptional 69.6% |
| Maltese | 99.7 /100 | #55 | Exceptional 69.5% |
| Immigrants | Scotland | 99.6 /100 | #56 | Exceptional 69.4% |
| Asians | 99.6 /100 | #57 | Exceptional 69.4% |
| Immigrants | Malaysia | 99.6 /100 | #58 | Exceptional 69.3% |
| Immigrants | Serbia | 99.5 /100 | #59 | Exceptional 69.3% |
| Immigrants | Asia | 99.5 /100 | #60 | Exceptional 69.2% |
| Immigrants | Kazakhstan | 99.5 /100 | #61 | Exceptional 69.2% |
| Immigrants | Belarus | 99.5 /100 | #62 | Exceptional 69.2% |
| Immigrants | Canada | 99.4 /100 | #63 | Exceptional 69.1% |
| Northern Europeans | 99.4 /100 | #64 | Exceptional 69.0% |
Demographics Similar to Italians by College, Under 1 year
In terms of college, under 1 year, the demographic groups most similar to Italians are Alsatian (67.1%, a difference of 0.060%), Arab (67.2%, a difference of 0.12%), Immigrants from Northern Africa (67.2%, a difference of 0.13%), Czech (67.1%, a difference of 0.14%), and Immigrants from Jordan (67.3%, a difference of 0.15%).
| Demographics | Rating | Rank | College, Under 1 year |
| Immigrants | Ukraine | 94.7 /100 | #118 | Exceptional 67.5% |
| Lebanese | 94.6 /100 | #119 | Exceptional 67.5% |
| Serbians | 93.9 /100 | #120 | Exceptional 67.4% |
| Slovenes | 93.3 /100 | #121 | Exceptional 67.3% |
| Immigrants | Jordan | 92.8 /100 | #122 | Exceptional 67.3% |
| Immigrants | Northern Africa | 92.7 /100 | #123 | Exceptional 67.2% |
| Arabs | 92.6 /100 | #124 | Exceptional 67.2% |
| Italians | 91.8 /100 | #125 | Exceptional 67.2% |
| Alsatians | 91.3 /100 | #126 | Exceptional 67.1% |
| Czechs | 90.8 /100 | #127 | Exceptional 67.1% |
| Scottish | 90.2 /100 | #128 | Exceptional 67.0% |
| Immigrants | Eastern Africa | 89.5 /100 | #129 | Excellent 67.0% |
| Immigrants | Syria | 89.0 /100 | #130 | Excellent 66.9% |
| Finns | 88.6 /100 | #131 | Excellent 66.9% |
| Poles | 88.4 /100 | #132 | Excellent 66.9% |