Houma vs Immigrants from Russia College, Under 1 year
COMPARE
Houma
Immigrants from Russia
College, Under 1 year
College, Under 1 year Comparison
Houma
Immigrants from Russia
47.6%
COLLEGE, UNDER 1 YEAR
0.0/ 100
METRIC RATING
346th/ 347
METRIC RANK
69.9%
COLLEGE, UNDER 1 YEAR
99.8/ 100
METRIC RATING
52nd/ 347
METRIC RANK
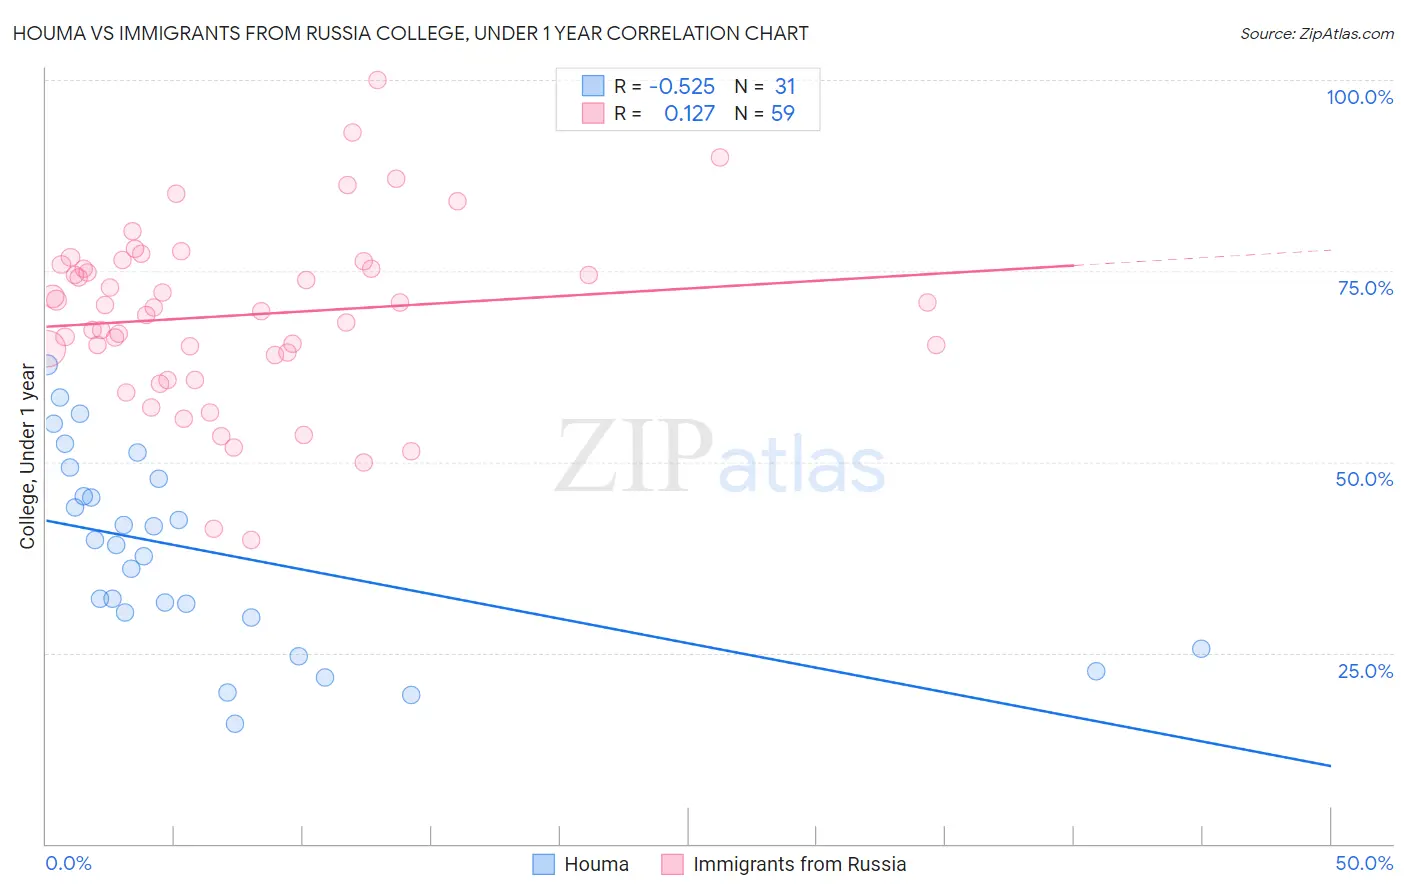
Houma vs Immigrants from Russia College, Under 1 year Correlation Chart
The statistical analysis conducted on geographies consisting of 36,795,916 people shows a substantial negative correlation between the proportion of Houma and percentage of population with at least college, under 1 year education in the United States with a correlation coefficient (R) of -0.525 and weighted average of 47.6%. Similarly, the statistical analysis conducted on geographies consisting of 347,947,137 people shows a poor positive correlation between the proportion of Immigrants from Russia and percentage of population with at least college, under 1 year education in the United States with a correlation coefficient (R) of 0.127 and weighted average of 69.9%, a difference of 46.6%.
College, Under 1 year Correlation Summary
| Measurement | Houma | Immigrants from Russia |
| Minimum | 15.6% | 39.8% |
| Maximum | 62.7% | 100.0% |
| Range | 47.1% | 60.2% |
| Mean | 38.1% | 69.2% |
| Median | 39.1% | 70.1% |
| Interquartile 25% (IQ1) | 29.7% | 64.1% |
| Interquartile 75% (IQ3) | 47.7% | 75.8% |
| Interquartile Range (IQR) | 18.1% | 11.8% |
| Standard Deviation (Sample) | 12.6% | 11.7% |
| Standard Deviation (Population) | 12.4% | 11.6% |
Similar Demographics by College, Under 1 year
Demographics Similar to Houma by College, Under 1 year
In terms of college, under 1 year, the demographic groups most similar to Houma are Yup'ik (45.8%, a difference of 4.1%), Pima (51.4%, a difference of 7.9%), Yakama (52.6%, a difference of 10.5%), Tohono O'odham (52.8%, a difference of 10.8%), and Immigrants from Mexico (53.7%, a difference of 12.6%).
| Demographics | Rating | Rank | College, Under 1 year |
| Yuman | 0.0 /100 | #333 | Tragic 55.1% |
| Immigrants | Azores | 0.0 /100 | #334 | Tragic 54.7% |
| Inupiat | 0.0 /100 | #335 | Tragic 54.6% |
| Pennsylvania Germans | 0.0 /100 | #336 | Tragic 54.5% |
| Immigrants | Central America | 0.0 /100 | #337 | Tragic 54.4% |
| Lumbee | 0.0 /100 | #338 | Tragic 54.2% |
| Immigrants | Dominican Republic | 0.0 /100 | #339 | Tragic 54.0% |
| Spanish American Indians | 0.0 /100 | #340 | Tragic 54.0% |
| Immigrants | Cabo Verde | 0.0 /100 | #341 | Tragic 53.7% |
| Immigrants | Mexico | 0.0 /100 | #342 | Tragic 53.7% |
| Tohono O'odham | 0.0 /100 | #343 | Tragic 52.8% |
| Yakama | 0.0 /100 | #344 | Tragic 52.6% |
| Pima | 0.0 /100 | #345 | Tragic 51.4% |
| Houma | 0.0 /100 | #346 | Tragic 47.6% |
| Yup'ik | 0.0 /100 | #347 | Tragic 45.8% |
Demographics Similar to Immigrants from Russia by College, Under 1 year
In terms of college, under 1 year, the demographic groups most similar to Immigrants from Russia are Mongolian (69.9%, a difference of 0.020%), Zimbabwean (69.9%, a difference of 0.060%), Immigrants from Austria (70.0%, a difference of 0.18%), Immigrants from Netherlands (70.0%, a difference of 0.22%), and South African (69.7%, a difference of 0.27%).
| Demographics | Rating | Rank | College, Under 1 year |
| Immigrants | Norway | 99.9 /100 | #45 | Exceptional 70.2% |
| Immigrants | Latvia | 99.9 /100 | #46 | Exceptional 70.1% |
| Immigrants | Bulgaria | 99.8 /100 | #47 | Exceptional 70.0% |
| Immigrants | Netherlands | 99.8 /100 | #48 | Exceptional 70.0% |
| Immigrants | Austria | 99.8 /100 | #49 | Exceptional 70.0% |
| Zimbabweans | 99.8 /100 | #50 | Exceptional 69.9% |
| Mongolians | 99.8 /100 | #51 | Exceptional 69.9% |
| Immigrants | Russia | 99.8 /100 | #52 | Exceptional 69.9% |
| South Africans | 99.7 /100 | #53 | Exceptional 69.7% |
| Immigrants | Czechoslovakia | 99.7 /100 | #54 | Exceptional 69.6% |
| Maltese | 99.7 /100 | #55 | Exceptional 69.5% |
| Immigrants | Scotland | 99.6 /100 | #56 | Exceptional 69.4% |
| Asians | 99.6 /100 | #57 | Exceptional 69.4% |
| Immigrants | Malaysia | 99.6 /100 | #58 | Exceptional 69.3% |
| Immigrants | Serbia | 99.5 /100 | #59 | Exceptional 69.3% |