Houma vs Immigrants from Guatemala Female Unemployment
COMPARE
Houma
Immigrants from Guatemala
Female Unemployment
Female Unemployment Comparison
Houma
Immigrants from Guatemala
6.4%
FEMALE UNEMPLOYMENT
0.0/ 100
METRIC RATING
316th/ 347
METRIC RANK
6.1%
FEMALE UNEMPLOYMENT
0.0/ 100
METRIC RATING
287th/ 347
METRIC RANK
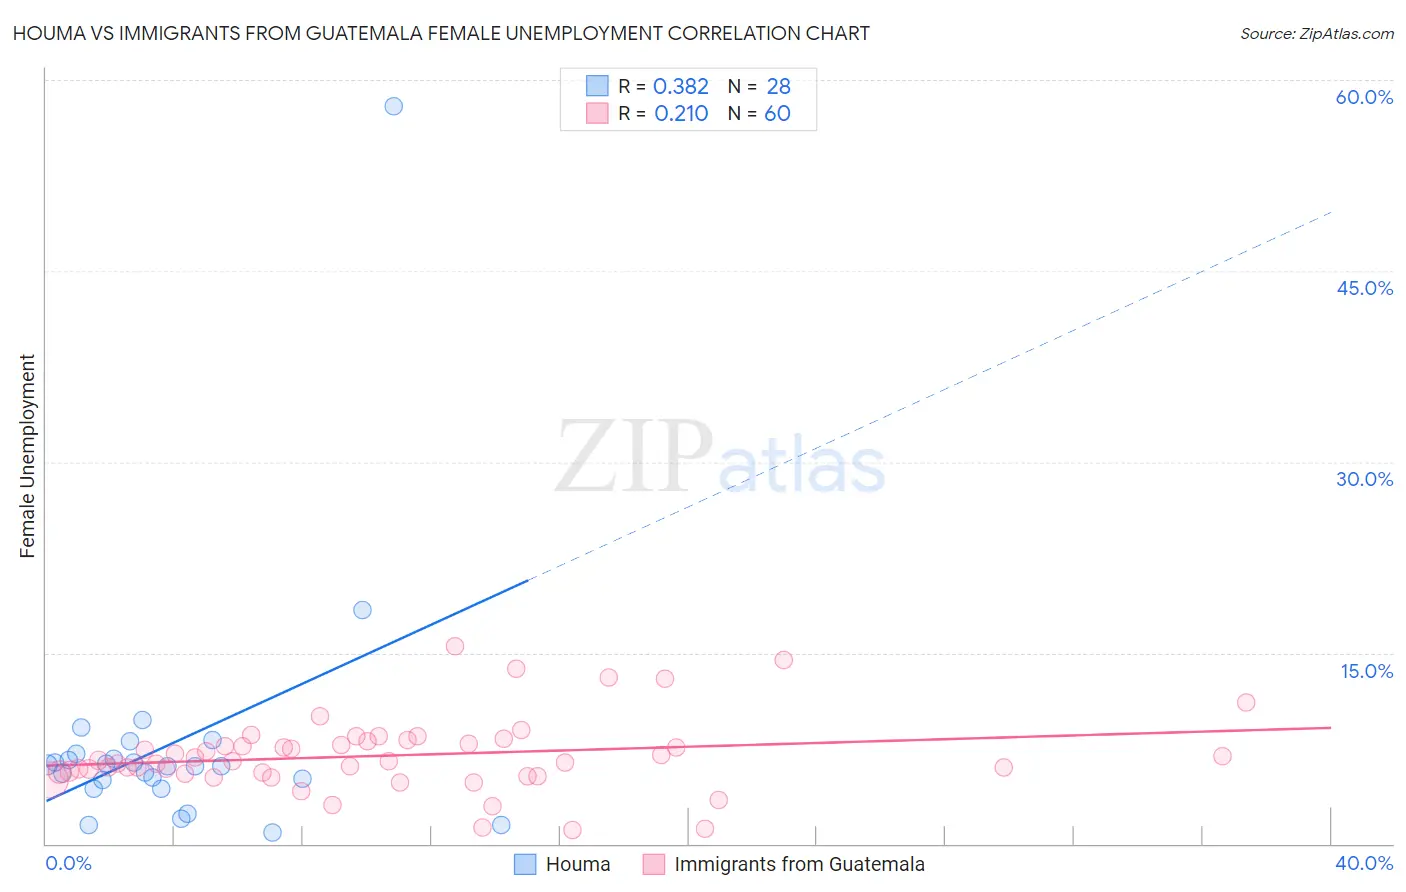
Houma vs Immigrants from Guatemala Female Unemployment Correlation Chart
The statistical analysis conducted on geographies consisting of 36,709,264 people shows a mild positive correlation between the proportion of Houma and unemploymnet rate among females in the United States with a correlation coefficient (R) of 0.382 and weighted average of 6.4%. Similarly, the statistical analysis conducted on geographies consisting of 375,756,424 people shows a weak positive correlation between the proportion of Immigrants from Guatemala and unemploymnet rate among females in the United States with a correlation coefficient (R) of 0.210 and weighted average of 6.1%, a difference of 5.1%.
Female Unemployment Correlation Summary
| Measurement | Houma | Immigrants from Guatemala |
| Minimum | 0.90% | 1.1% |
| Maximum | 57.9% | 15.6% |
| Range | 57.0% | 14.5% |
| Mean | 7.8% | 6.9% |
| Median | 6.1% | 6.5% |
| Interquartile 25% (IQ1) | 4.7% | 5.5% |
| Interquartile 75% (IQ3) | 6.9% | 8.0% |
| Interquartile Range (IQR) | 2.2% | 2.4% |
| Standard Deviation (Sample) | 10.4% | 2.9% |
| Standard Deviation (Population) | 10.2% | 2.9% |
Similar Demographics by Female Unemployment
Demographics Similar to Houma by Female Unemployment
In terms of female unemployment, the demographic groups most similar to Houma are Pueblo (6.4%, a difference of 0.29%), Immigrants from St. Vincent and the Grenadines (6.4%, a difference of 0.45%), Immigrants from Ecuador (6.4%, a difference of 0.60%), British West Indian (6.4%, a difference of 0.73%), and Belizean (6.3%, a difference of 0.83%).
| Demographics | Rating | Rank | Female Unemployment |
| Ecuadorians | 0.0 /100 | #309 | Tragic 6.3% |
| Central American Indians | 0.0 /100 | #310 | Tragic 6.3% |
| Immigrants | Mexico | 0.0 /100 | #311 | Tragic 6.3% |
| Immigrants | Grenada | 0.0 /100 | #312 | Tragic 6.3% |
| Belizeans | 0.0 /100 | #313 | Tragic 6.3% |
| Immigrants | Ecuador | 0.0 /100 | #314 | Tragic 6.4% |
| Pueblo | 0.0 /100 | #315 | Tragic 6.4% |
| Houma | 0.0 /100 | #316 | Tragic 6.4% |
| Immigrants | St. Vincent and the Grenadines | 0.0 /100 | #317 | Tragic 6.4% |
| British West Indians | 0.0 /100 | #318 | Tragic 6.4% |
| Immigrants | Bangladesh | 0.0 /100 | #319 | Tragic 6.5% |
| Immigrants | Dominica | 0.0 /100 | #320 | Tragic 6.5% |
| Blacks/African Americans | 0.0 /100 | #321 | Tragic 6.5% |
| Vietnamese | 0.0 /100 | #322 | Tragic 6.5% |
| Immigrants | Belize | 0.0 /100 | #323 | Tragic 6.5% |
Demographics Similar to Immigrants from Guatemala by Female Unemployment
In terms of female unemployment, the demographic groups most similar to Immigrants from Guatemala are Chippewa (6.1%, a difference of 0.030%), Haitian (6.1%, a difference of 0.040%), Immigrants from Cabo Verde (6.1%, a difference of 0.050%), Trinidadian and Tobagonian (6.1%, a difference of 0.050%), and Immigrants from Caribbean (6.1%, a difference of 0.11%).
| Demographics | Rating | Rank | Female Unemployment |
| Mexican American Indians | 0.0 /100 | #280 | Tragic 6.0% |
| Guatemalans | 0.0 /100 | #281 | Tragic 6.0% |
| Colville | 0.0 /100 | #282 | Tragic 6.0% |
| Salvadorans | 0.0 /100 | #283 | Tragic 6.0% |
| Immigrants | Senegal | 0.0 /100 | #284 | Tragic 6.1% |
| Immigrants | Cabo Verde | 0.0 /100 | #285 | Tragic 6.1% |
| Chippewa | 0.0 /100 | #286 | Tragic 6.1% |
| Immigrants | Guatemala | 0.0 /100 | #287 | Tragic 6.1% |
| Haitians | 0.0 /100 | #288 | Tragic 6.1% |
| Trinidadians and Tobagonians | 0.0 /100 | #289 | Tragic 6.1% |
| Immigrants | Caribbean | 0.0 /100 | #290 | Tragic 6.1% |
| Immigrants | West Indies | 0.0 /100 | #291 | Tragic 6.1% |
| Immigrants | Trinidad and Tobago | 0.0 /100 | #292 | Tragic 6.1% |
| Mexicans | 0.0 /100 | #293 | Tragic 6.1% |
| Immigrants | El Salvador | 0.0 /100 | #294 | Tragic 6.1% |