Houma vs Immigrants from Guatemala 8th Grade
COMPARE
Houma
Immigrants from Guatemala
8th Grade
8th Grade Comparison
Houma
Immigrants from Guatemala
94.2%
8TH GRADE
0.0/ 100
METRIC RATING
294th/ 347
METRIC RANK
90.7%
8TH GRADE
0.0/ 100
METRIC RATING
343rd/ 347
METRIC RANK
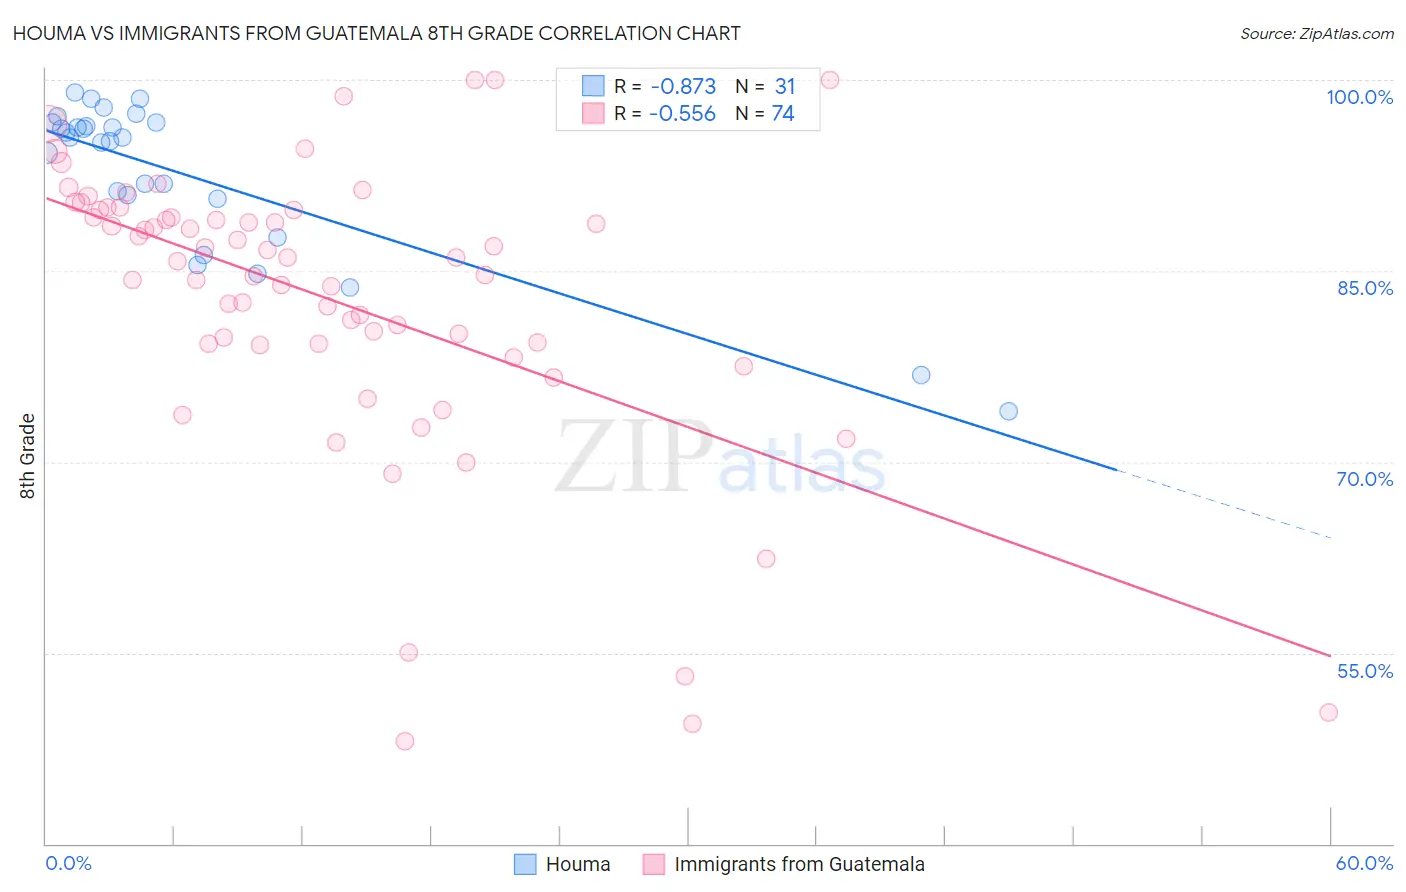
Houma vs Immigrants from Guatemala 8th Grade Correlation Chart
The statistical analysis conducted on geographies consisting of 36,795,916 people shows a very strong negative correlation between the proportion of Houma and percentage of population with at least 8th grade education in the United States with a correlation coefficient (R) of -0.873 and weighted average of 94.2%. Similarly, the statistical analysis conducted on geographies consisting of 377,286,142 people shows a substantial negative correlation between the proportion of Immigrants from Guatemala and percentage of population with at least 8th grade education in the United States with a correlation coefficient (R) of -0.556 and weighted average of 90.7%, a difference of 3.8%.
8th Grade Correlation Summary
| Measurement | Houma | Immigrants from Guatemala |
| Minimum | 74.0% | 48.1% |
| Maximum | 99.0% | 100.0% |
| Range | 25.0% | 51.9% |
| Mean | 92.6% | 82.8% |
| Median | 95.5% | 85.9% |
| Interquartile 25% (IQ1) | 90.6% | 79.2% |
| Interquartile 75% (IQ3) | 96.7% | 89.8% |
| Interquartile Range (IQR) | 6.0% | 10.5% |
| Standard Deviation (Sample) | 6.3% | 11.4% |
| Standard Deviation (Population) | 6.2% | 11.3% |
Similar Demographics by 8th Grade
Demographics Similar to Houma by 8th Grade
In terms of 8th grade, the demographic groups most similar to Houma are Yaqui (94.2%, a difference of 0.0%), Fijian (94.2%, a difference of 0.010%), Bangladeshi (94.3%, a difference of 0.030%), Haitian (94.2%, a difference of 0.030%), and Immigrants from South Eastern Asia (94.2%, a difference of 0.040%).
| Demographics | Rating | Rank | 8th Grade |
| Tohono O'odham | 0.0 /100 | #287 | Tragic 94.5% |
| Malaysians | 0.0 /100 | #288 | Tragic 94.5% |
| British West Indians | 0.0 /100 | #289 | Tragic 94.4% |
| Immigrants | West Indies | 0.0 /100 | #290 | Tragic 94.3% |
| Immigrants | Grenada | 0.0 /100 | #291 | Tragic 94.3% |
| Bangladeshis | 0.0 /100 | #292 | Tragic 94.3% |
| Yaqui | 0.0 /100 | #293 | Tragic 94.2% |
| Houma | 0.0 /100 | #294 | Tragic 94.2% |
| Fijians | 0.0 /100 | #295 | Tragic 94.2% |
| Haitians | 0.0 /100 | #296 | Tragic 94.2% |
| Immigrants | South Eastern Asia | 0.0 /100 | #297 | Tragic 94.2% |
| Indonesians | 0.0 /100 | #298 | Tragic 94.1% |
| Cubans | 0.0 /100 | #299 | Tragic 94.1% |
| Immigrants | Burma/Myanmar | 0.0 /100 | #300 | Tragic 94.1% |
| Immigrants | Laos | 0.0 /100 | #301 | Tragic 94.1% |
Demographics Similar to Immigrants from Guatemala by 8th Grade
In terms of 8th grade, the demographic groups most similar to Immigrants from Guatemala are Salvadoran (90.9%, a difference of 0.17%), Immigrants from Central America (90.4%, a difference of 0.37%), Guatemalan (91.1%, a difference of 0.46%), Immigrants from El Salvador (90.3%, a difference of 0.46%), and Yakama (91.2%, a difference of 0.57%).
| Demographics | Rating | Rank | 8th Grade |
| Hispanics or Latinos | 0.0 /100 | #333 | Tragic 92.2% |
| Immigrants | Yemen | 0.0 /100 | #334 | Tragic 92.1% |
| Mexican American Indians | 0.0 /100 | #335 | Tragic 92.1% |
| Immigrants | Honduras | 0.0 /100 | #336 | Tragic 91.9% |
| Immigrants | Latin America | 0.0 /100 | #337 | Tragic 91.7% |
| Central Americans | 0.0 /100 | #338 | Tragic 91.6% |
| Mexicans | 0.0 /100 | #339 | Tragic 91.4% |
| Yakama | 0.0 /100 | #340 | Tragic 91.2% |
| Guatemalans | 0.0 /100 | #341 | Tragic 91.1% |
| Salvadorans | 0.0 /100 | #342 | Tragic 90.9% |
| Immigrants | Guatemala | 0.0 /100 | #343 | Tragic 90.7% |
| Immigrants | Central America | 0.0 /100 | #344 | Tragic 90.4% |
| Immigrants | El Salvador | 0.0 /100 | #345 | Tragic 90.3% |
| Immigrants | Mexico | 0.0 /100 | #346 | Tragic 90.2% |
| Spanish American Indians | 0.0 /100 | #347 | Tragic 89.8% |