Venezuelan vs Albanian High School Diploma
COMPARE
Venezuelan
Albanian
High School Diploma
High School Diploma Comparison
Venezuelans
Albanians
89.1%
HIGH SCHOOL DIPLOMA
43.6/ 100
METRIC RATING
181st/ 347
METRIC RANK
89.8%
HIGH SCHOOL DIPLOMA
87.2/ 100
METRIC RATING
133rd/ 347
METRIC RANK
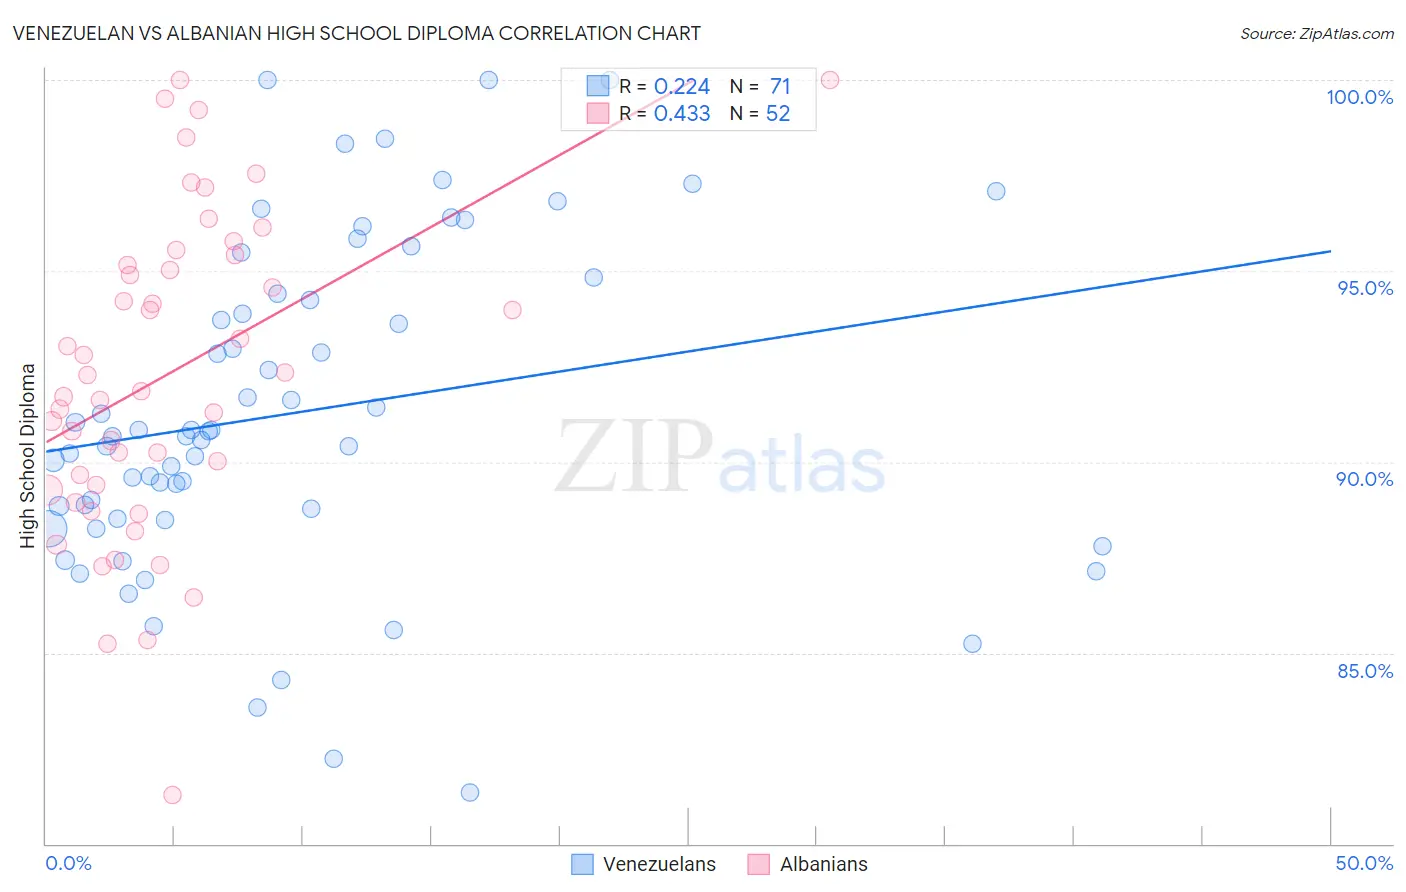
Venezuelan vs Albanian High School Diploma Correlation Chart
The statistical analysis conducted on geographies consisting of 306,323,638 people shows a weak positive correlation between the proportion of Venezuelans and percentage of population with at least high school diploma education in the United States with a correlation coefficient (R) of 0.224 and weighted average of 89.1%. Similarly, the statistical analysis conducted on geographies consisting of 193,265,850 people shows a moderate positive correlation between the proportion of Albanians and percentage of population with at least high school diploma education in the United States with a correlation coefficient (R) of 0.433 and weighted average of 89.8%, a difference of 0.82%.
High School Diploma Correlation Summary
| Measurement | Venezuelan | Albanian |
| Minimum | 81.3% | 81.3% |
| Maximum | 100.0% | 100.0% |
| Range | 18.7% | 18.7% |
| Mean | 91.3% | 92.3% |
| Median | 90.7% | 92.1% |
| Interquartile 25% (IQ1) | 88.5% | 89.3% |
| Interquartile 75% (IQ3) | 94.4% | 95.3% |
| Interquartile Range (IQR) | 5.9% | 6.0% |
| Standard Deviation (Sample) | 4.3% | 4.2% |
| Standard Deviation (Population) | 4.2% | 4.1% |
Similar Demographics by High School Diploma
Demographics Similar to Venezuelans by High School Diploma
In terms of high school diploma, the demographic groups most similar to Venezuelans are Spaniard (89.1%, a difference of 0.0%), Bolivian (89.1%, a difference of 0.020%), Potawatomi (89.0%, a difference of 0.020%), American (89.1%, a difference of 0.050%), and Sudanese (89.1%, a difference of 0.070%).
| Demographics | Rating | Rank | High School Diploma |
| Hmong | 50.0 /100 | #174 | Average 89.1% |
| Immigrants | Western Asia | 49.0 /100 | #175 | Average 89.1% |
| Osage | 48.9 /100 | #176 | Average 89.1% |
| Sudanese | 48.5 /100 | #177 | Average 89.1% |
| Sierra Leoneans | 48.4 /100 | #178 | Average 89.1% |
| Americans | 47.2 /100 | #179 | Average 89.1% |
| Bolivians | 45.2 /100 | #180 | Average 89.1% |
| Venezuelans | 43.6 /100 | #181 | Average 89.1% |
| Spaniards | 43.4 /100 | #182 | Average 89.1% |
| Potawatomi | 42.5 /100 | #183 | Average 89.0% |
| Immigrants | Syria | 39.2 /100 | #184 | Fair 89.0% |
| Ethiopians | 37.0 /100 | #185 | Fair 89.0% |
| Immigrants | Eastern Africa | 35.8 /100 | #186 | Fair 88.9% |
| Guamanians/Chamorros | 35.5 /100 | #187 | Fair 88.9% |
| Immigrants | Sudan | 33.4 /100 | #188 | Fair 88.9% |
Demographics Similar to Albanians by High School Diploma
In terms of high school diploma, the demographic groups most similar to Albanians are Immigrants from Bosnia and Herzegovina (89.8%, a difference of 0.0%), Immigrants from Jordan (89.8%, a difference of 0.0%), Immigrants from Italy (89.8%, a difference of 0.010%), Immigrants from Ukraine (89.8%, a difference of 0.020%), and Basque (89.8%, a difference of 0.040%).
| Demographics | Rating | Rank | High School Diploma |
| Alaska Natives | 91.0 /100 | #126 | Exceptional 89.9% |
| Immigrants | Eastern Asia | 89.2 /100 | #127 | Excellent 89.9% |
| Puget Sound Salish | 89.1 /100 | #128 | Excellent 89.9% |
| Basques | 88.5 /100 | #129 | Excellent 89.8% |
| Immigrants | Ukraine | 87.9 /100 | #130 | Excellent 89.8% |
| Immigrants | Italy | 87.4 /100 | #131 | Excellent 89.8% |
| Immigrants | Bosnia and Herzegovina | 87.3 /100 | #132 | Excellent 89.8% |
| Albanians | 87.2 /100 | #133 | Excellent 89.8% |
| Immigrants | Jordan | 87.2 /100 | #134 | Excellent 89.8% |
| Chippewa | 85.6 /100 | #135 | Excellent 89.7% |
| Ugandans | 83.7 /100 | #136 | Excellent 89.7% |
| Arabs | 83.6 /100 | #137 | Excellent 89.7% |
| Assyrians/Chaldeans/Syriacs | 82.5 /100 | #138 | Excellent 89.7% |
| Kenyans | 81.4 /100 | #139 | Excellent 89.6% |
| Immigrants | Egypt | 81.2 /100 | #140 | Excellent 89.6% |