Hungarian vs Albanian High School Diploma
COMPARE
Hungarian
Albanian
High School Diploma
High School Diploma Comparison
Hungarians
Albanians
90.8%
HIGH SCHOOL DIPLOMA
99.3/ 100
METRIC RATING
76th/ 347
METRIC RANK
89.8%
HIGH SCHOOL DIPLOMA
87.2/ 100
METRIC RATING
133rd/ 347
METRIC RANK
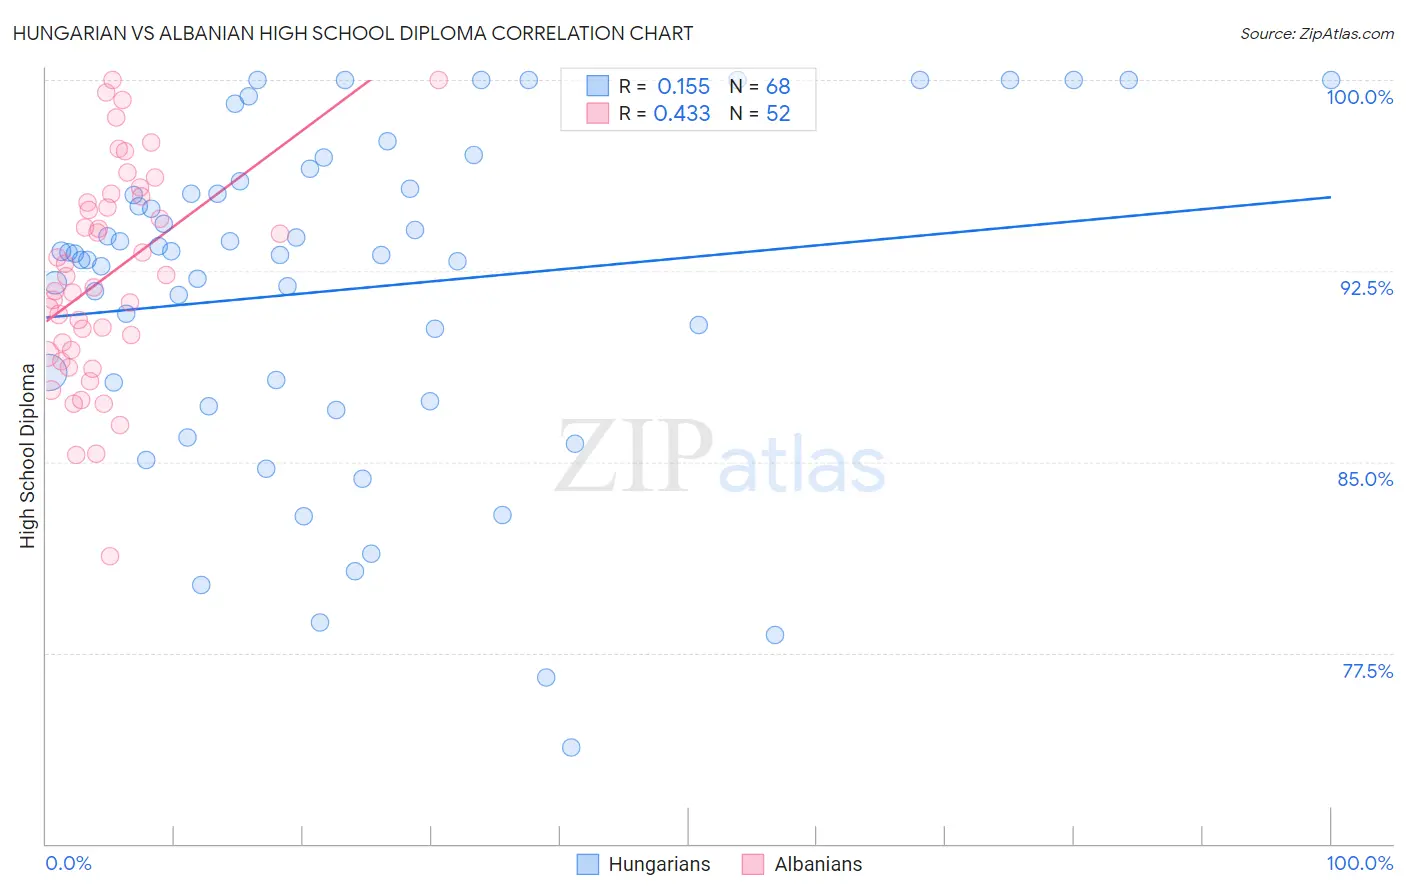
Hungarian vs Albanian High School Diploma Correlation Chart
The statistical analysis conducted on geographies consisting of 486,240,766 people shows a poor positive correlation between the proportion of Hungarians and percentage of population with at least high school diploma education in the United States with a correlation coefficient (R) of 0.155 and weighted average of 90.8%. Similarly, the statistical analysis conducted on geographies consisting of 193,265,850 people shows a moderate positive correlation between the proportion of Albanians and percentage of population with at least high school diploma education in the United States with a correlation coefficient (R) of 0.433 and weighted average of 89.8%, a difference of 1.2%.
High School Diploma Correlation Summary
| Measurement | Hungarian | Albanian |
| Minimum | 73.8% | 81.3% |
| Maximum | 100.0% | 100.0% |
| Range | 26.2% | 18.7% |
| Mean | 91.8% | 92.3% |
| Median | 93.2% | 92.1% |
| Interquartile 25% (IQ1) | 87.8% | 89.3% |
| Interquartile 75% (IQ3) | 95.9% | 95.3% |
| Interquartile Range (IQR) | 8.1% | 6.0% |
| Standard Deviation (Sample) | 6.5% | 4.2% |
| Standard Deviation (Population) | 6.4% | 4.1% |
Similar Demographics by High School Diploma
Demographics Similar to Hungarians by High School Diploma
In terms of high school diploma, the demographic groups most similar to Hungarians are Cambodian (90.8%, a difference of 0.010%), Native Hawaiian (90.8%, a difference of 0.010%), Burmese (90.8%, a difference of 0.010%), Immigrants from Denmark (90.8%, a difference of 0.020%), and Immigrants from Czechoslovakia (90.9%, a difference of 0.030%).
| Demographics | Rating | Rank | High School Diploma |
| French Canadians | 99.5 /100 | #69 | Exceptional 90.9% |
| Immigrants | Latvia | 99.5 /100 | #70 | Exceptional 90.9% |
| Alaskan Athabascans | 99.4 /100 | #71 | Exceptional 90.9% |
| Soviet Union | 99.4 /100 | #72 | Exceptional 90.9% |
| Immigrants | South Central Asia | 99.4 /100 | #73 | Exceptional 90.9% |
| Immigrants | Czechoslovakia | 99.4 /100 | #74 | Exceptional 90.9% |
| Cambodians | 99.4 /100 | #75 | Exceptional 90.8% |
| Hungarians | 99.3 /100 | #76 | Exceptional 90.8% |
| Native Hawaiians | 99.3 /100 | #77 | Exceptional 90.8% |
| Burmese | 99.3 /100 | #78 | Exceptional 90.8% |
| Immigrants | Denmark | 99.3 /100 | #79 | Exceptional 90.8% |
| Immigrants | England | 99.3 /100 | #80 | Exceptional 90.8% |
| Immigrants | Switzerland | 99.3 /100 | #81 | Exceptional 90.8% |
| Scotch-Irish | 99.2 /100 | #82 | Exceptional 90.8% |
| Immigrants | Moldova | 99.2 /100 | #83 | Exceptional 90.7% |
Demographics Similar to Albanians by High School Diploma
In terms of high school diploma, the demographic groups most similar to Albanians are Immigrants from Bosnia and Herzegovina (89.8%, a difference of 0.0%), Immigrants from Jordan (89.8%, a difference of 0.0%), Immigrants from Italy (89.8%, a difference of 0.010%), Immigrants from Ukraine (89.8%, a difference of 0.020%), and Basque (89.8%, a difference of 0.040%).
| Demographics | Rating | Rank | High School Diploma |
| Alaska Natives | 91.0 /100 | #126 | Exceptional 89.9% |
| Immigrants | Eastern Asia | 89.2 /100 | #127 | Excellent 89.9% |
| Puget Sound Salish | 89.1 /100 | #128 | Excellent 89.9% |
| Basques | 88.5 /100 | #129 | Excellent 89.8% |
| Immigrants | Ukraine | 87.9 /100 | #130 | Excellent 89.8% |
| Immigrants | Italy | 87.4 /100 | #131 | Excellent 89.8% |
| Immigrants | Bosnia and Herzegovina | 87.3 /100 | #132 | Excellent 89.8% |
| Albanians | 87.2 /100 | #133 | Excellent 89.8% |
| Immigrants | Jordan | 87.2 /100 | #134 | Excellent 89.8% |
| Chippewa | 85.6 /100 | #135 | Excellent 89.7% |
| Ugandans | 83.7 /100 | #136 | Excellent 89.7% |
| Arabs | 83.6 /100 | #137 | Excellent 89.7% |
| Assyrians/Chaldeans/Syriacs | 82.5 /100 | #138 | Excellent 89.7% |
| Kenyans | 81.4 /100 | #139 | Excellent 89.6% |
| Immigrants | Egypt | 81.2 /100 | #140 | Excellent 89.6% |