Hopi vs Yakama Master's Degree
COMPARE
Hopi
Yakama
Master's Degree
Master's Degree Comparison
Hopi
Yakama
10.9%
MASTER'S DEGREE
0.0/ 100
METRIC RATING
317th/ 347
METRIC RANK
9.5%
MASTER'S DEGREE
0.0/ 100
METRIC RATING
340th/ 347
METRIC RANK
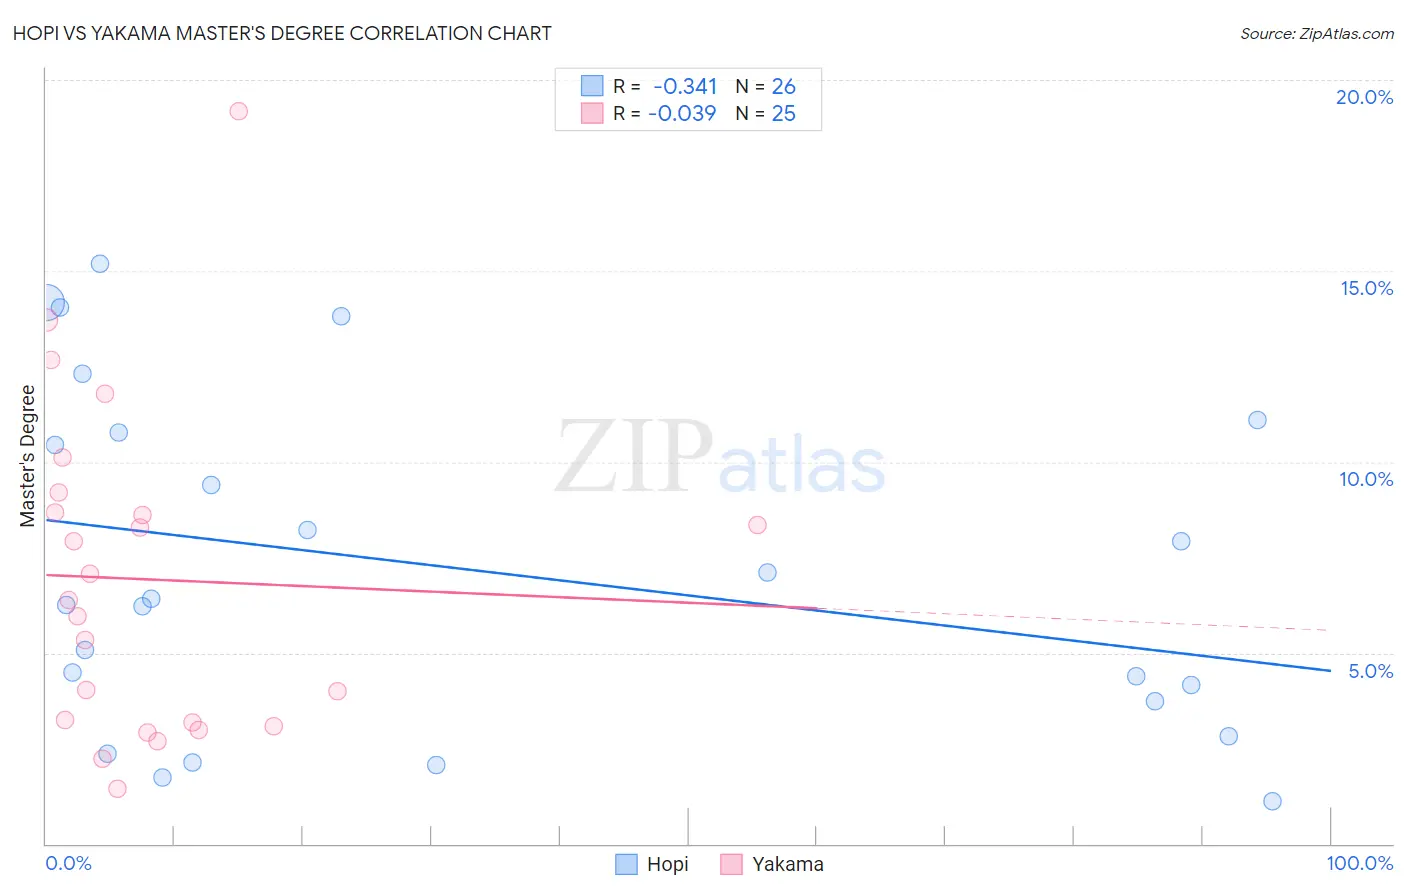
Hopi vs Yakama Master's Degree Correlation Chart
The statistical analysis conducted on geographies consisting of 74,729,525 people shows a mild negative correlation between the proportion of Hopi and percentage of population with at least master's degree education in the United States with a correlation coefficient (R) of -0.341 and weighted average of 10.9%. Similarly, the statistical analysis conducted on geographies consisting of 19,918,334 people shows no correlation between the proportion of Yakama and percentage of population with at least master's degree education in the United States with a correlation coefficient (R) of -0.039 and weighted average of 9.5%, a difference of 14.9%.
Master's Degree Correlation Summary
| Measurement | Hopi | Yakama |
| Minimum | 1.1% | 1.4% |
| Maximum | 15.2% | 19.2% |
| Range | 14.1% | 17.7% |
| Mean | 7.2% | 6.9% |
| Median | 6.3% | 6.4% |
| Interquartile 25% (IQ1) | 3.7% | 3.1% |
| Interquartile 75% (IQ3) | 10.8% | 8.9% |
| Interquartile Range (IQR) | 7.0% | 5.8% |
| Standard Deviation (Sample) | 4.4% | 4.3% |
| Standard Deviation (Population) | 4.3% | 4.2% |
Similar Demographics by Master's Degree
Demographics Similar to Hopi by Master's Degree
In terms of master's degree, the demographic groups most similar to Hopi are Immigrants from Cuba (10.9%, a difference of 0.13%), Kiowa (10.8%, a difference of 0.37%), Hispanic or Latino (10.9%, a difference of 0.54%), Cajun (11.0%, a difference of 0.88%), and Apache (11.0%, a difference of 0.88%).
| Demographics | Rating | Rank | Master's Degree |
| Shoshone | 0.0 /100 | #310 | Tragic 11.1% |
| Seminole | 0.0 /100 | #311 | Tragic 11.0% |
| Choctaw | 0.0 /100 | #312 | Tragic 11.0% |
| Yaqui | 0.0 /100 | #313 | Tragic 11.0% |
| Cajuns | 0.0 /100 | #314 | Tragic 11.0% |
| Apache | 0.0 /100 | #315 | Tragic 11.0% |
| Hispanics or Latinos | 0.0 /100 | #316 | Tragic 10.9% |
| Hopi | 0.0 /100 | #317 | Tragic 10.9% |
| Immigrants | Cuba | 0.0 /100 | #318 | Tragic 10.9% |
| Kiowa | 0.0 /100 | #319 | Tragic 10.8% |
| Immigrants | Micronesia | 0.0 /100 | #320 | Tragic 10.8% |
| Pennsylvania Germans | 0.0 /100 | #321 | Tragic 10.7% |
| Sioux | 0.0 /100 | #322 | Tragic 10.7% |
| Crow | 0.0 /100 | #323 | Tragic 10.6% |
| Dutch West Indians | 0.0 /100 | #324 | Tragic 10.6% |
Demographics Similar to Yakama by Master's Degree
In terms of master's degree, the demographic groups most similar to Yakama are Navajo (9.4%, a difference of 0.35%), Spanish American Indian (9.6%, a difference of 1.2%), Immigrants from Mexico (9.3%, a difference of 1.6%), Lumbee (9.3%, a difference of 2.1%), and Pima (9.2%, a difference of 2.3%).
| Demographics | Rating | Rank | Master's Degree |
| Menominee | 0.0 /100 | #333 | Tragic 10.2% |
| Arapaho | 0.0 /100 | #334 | Tragic 10.0% |
| Immigrants | Central America | 0.0 /100 | #335 | Tragic 10.0% |
| Natives/Alaskans | 0.0 /100 | #336 | Tragic 9.9% |
| Mexicans | 0.0 /100 | #337 | Tragic 9.7% |
| Tohono O'odham | 0.0 /100 | #338 | Tragic 9.7% |
| Spanish American Indians | 0.0 /100 | #339 | Tragic 9.6% |
| Yakama | 0.0 /100 | #340 | Tragic 9.5% |
| Navajo | 0.0 /100 | #341 | Tragic 9.4% |
| Immigrants | Mexico | 0.0 /100 | #342 | Tragic 9.3% |
| Lumbee | 0.0 /100 | #343 | Tragic 9.3% |
| Pima | 0.0 /100 | #344 | Tragic 9.2% |
| Yuman | 0.0 /100 | #345 | Tragic 9.2% |
| Yup'ik | 0.0 /100 | #346 | Tragic 8.5% |
| Houma | 0.0 /100 | #347 | Tragic 7.9% |