Hopi vs Lumbee 2 or more Vehicles in Household
COMPARE
Hopi
Lumbee
2 or more Vehicles in Household
2 or more Vehicles in Household Comparison
Hopi
Lumbee
49.0%
2 OR MORE VEHICLES IN HOUSEHOLD
0.0/ 100
METRIC RATING
307th/ 347
METRIC RANK
55.9%
2 OR MORE VEHICLES IN HOUSEHOLD
71.9/ 100
METRIC RATING
153rd/ 347
METRIC RANK
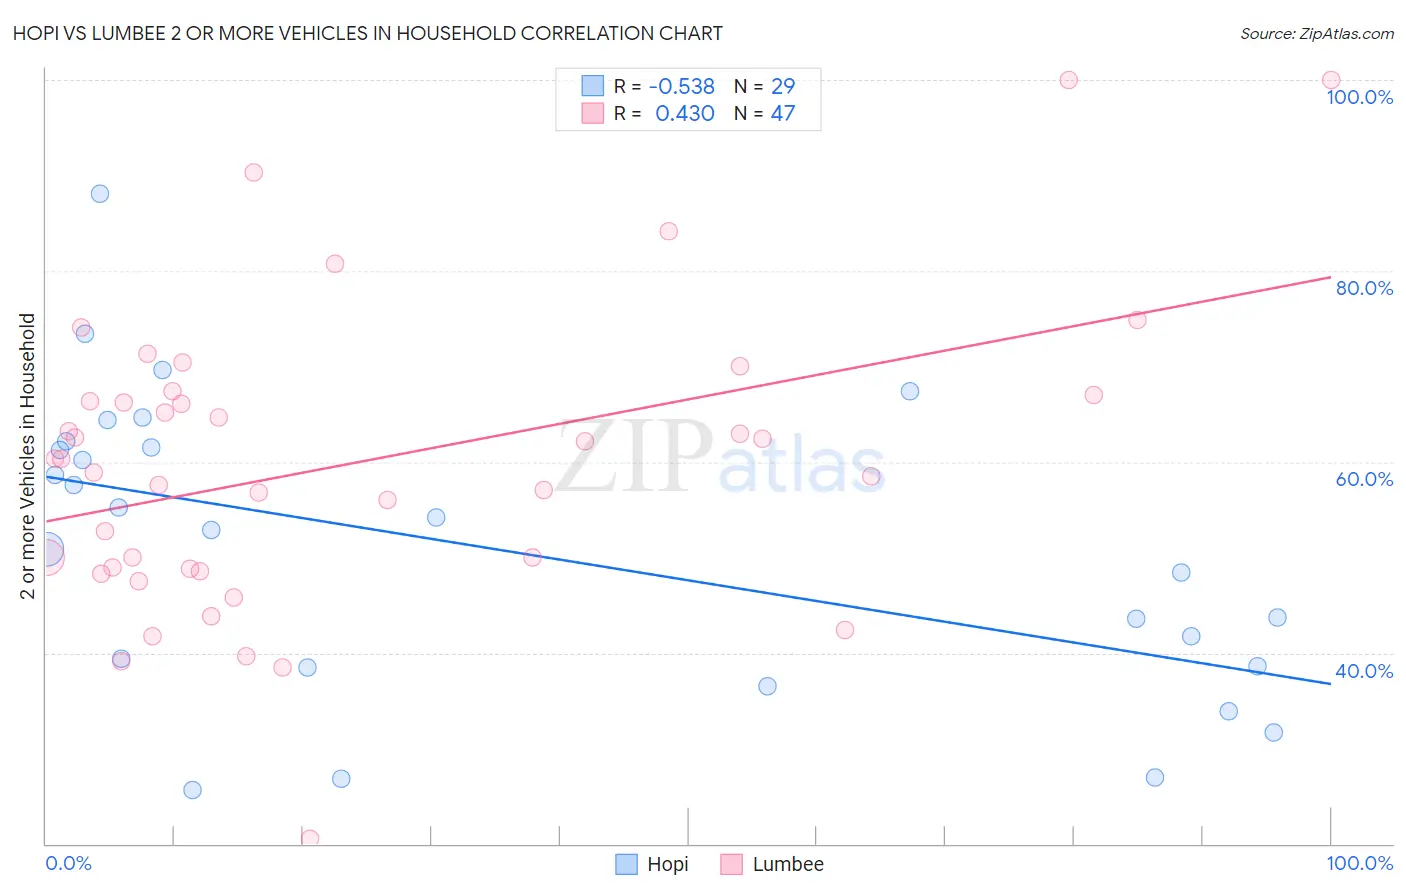
Hopi vs Lumbee 2 or more Vehicles in Household Correlation Chart
The statistical analysis conducted on geographies consisting of 74,733,485 people shows a substantial negative correlation between the proportion of Hopi and percentage of households with 2 or more vehicles available in the United States with a correlation coefficient (R) of -0.538 and weighted average of 49.0%. Similarly, the statistical analysis conducted on geographies consisting of 92,265,071 people shows a moderate positive correlation between the proportion of Lumbee and percentage of households with 2 or more vehicles available in the United States with a correlation coefficient (R) of 0.430 and weighted average of 55.9%, a difference of 14.0%.
2 or more Vehicles in Household Correlation Summary
| Measurement | Hopi | Lumbee |
| Minimum | 25.6% | 20.5% |
| Maximum | 88.1% | 100.0% |
| Range | 62.5% | 79.5% |
| Mean | 50.9% | 59.9% |
| Median | 52.9% | 60.3% |
| Interquartile 25% (IQ1) | 38.5% | 48.9% |
| Interquartile 75% (IQ3) | 61.8% | 67.0% |
| Interquartile Range (IQR) | 23.2% | 18.1% |
| Standard Deviation (Sample) | 15.5% | 15.6% |
| Standard Deviation (Population) | 15.3% | 15.5% |
Similar Demographics by 2 or more Vehicles in Household
Demographics Similar to Hopi by 2 or more Vehicles in Household
In terms of 2 or more vehicles in household, the demographic groups most similar to Hopi are Albanian (49.0%, a difference of 0.070%), Moroccan (48.8%, a difference of 0.42%), Immigrants from Israel (49.2%, a difference of 0.43%), Immigrants from Western Africa (49.4%, a difference of 0.69%), and Immigrants from Belize (49.9%, a difference of 1.8%).
| Demographics | Rating | Rank | 2 or more Vehicles in Household |
| Immigrants | Russia | 0.0 /100 | #300 | Tragic 50.3% |
| Immigrants | Greece | 0.0 /100 | #301 | Tragic 50.2% |
| Immigrants | South America | 0.0 /100 | #302 | Tragic 50.2% |
| Tohono O'odham | 0.0 /100 | #303 | Tragic 50.0% |
| Immigrants | Belize | 0.0 /100 | #304 | Tragic 49.9% |
| Immigrants | Western Africa | 0.0 /100 | #305 | Tragic 49.4% |
| Immigrants | Israel | 0.0 /100 | #306 | Tragic 49.2% |
| Hopi | 0.0 /100 | #307 | Tragic 49.0% |
| Albanians | 0.0 /100 | #308 | Tragic 49.0% |
| Moroccans | 0.0 /100 | #309 | Tragic 48.8% |
| Ghanaians | 0.0 /100 | #310 | Tragic 48.0% |
| Immigrants | Belarus | 0.0 /100 | #311 | Tragic 47.9% |
| Haitians | 0.0 /100 | #312 | Tragic 47.6% |
| U.S. Virgin Islanders | 0.0 /100 | #313 | Tragic 47.5% |
| Immigrants | Ghana | 0.0 /100 | #314 | Tragic 47.4% |
Demographics Similar to Lumbee by 2 or more Vehicles in Household
In terms of 2 or more vehicles in household, the demographic groups most similar to Lumbee are Ukrainian (55.8%, a difference of 0.060%), Immigrants from Venezuela (55.8%, a difference of 0.060%), Immigrants from Lithuania (55.8%, a difference of 0.070%), Immigrants from Kuwait (55.8%, a difference of 0.080%), and Tlingit-Haida (55.8%, a difference of 0.16%).
| Demographics | Rating | Rank | 2 or more Vehicles in Household |
| Venezuelans | 80.7 /100 | #146 | Excellent 56.1% |
| Serbians | 80.3 /100 | #147 | Excellent 56.1% |
| Immigrants | Moldova | 80.2 /100 | #148 | Excellent 56.1% |
| Chileans | 80.2 /100 | #149 | Excellent 56.1% |
| Nicaraguans | 79.9 /100 | #150 | Good 56.1% |
| Immigrants | Northern Europe | 78.7 /100 | #151 | Good 56.1% |
| Immigrants | Pakistan | 78.1 /100 | #152 | Good 56.1% |
| Lumbee | 71.9 /100 | #153 | Good 55.9% |
| Ukrainians | 70.8 /100 | #154 | Good 55.8% |
| Immigrants | Venezuela | 70.7 /100 | #155 | Good 55.8% |
| Immigrants | Lithuania | 70.4 /100 | #156 | Good 55.8% |
| Immigrants | Kuwait | 70.2 /100 | #157 | Good 55.8% |
| Tlingit-Haida | 68.5 /100 | #158 | Good 55.8% |
| Paiute | 68.0 /100 | #159 | Good 55.8% |
| Crow | 67.0 /100 | #160 | Good 55.7% |