Honduran vs Ghanaian 10th Grade
COMPARE
Honduran
Ghanaian
10th Grade
10th Grade Comparison
Hondurans
Ghanaians
89.0%
10TH GRADE
0.0/ 100
METRIC RATING
333rd/ 347
METRIC RANK
92.8%
10TH GRADE
0.9/ 100
METRIC RATING
253rd/ 347
METRIC RANK
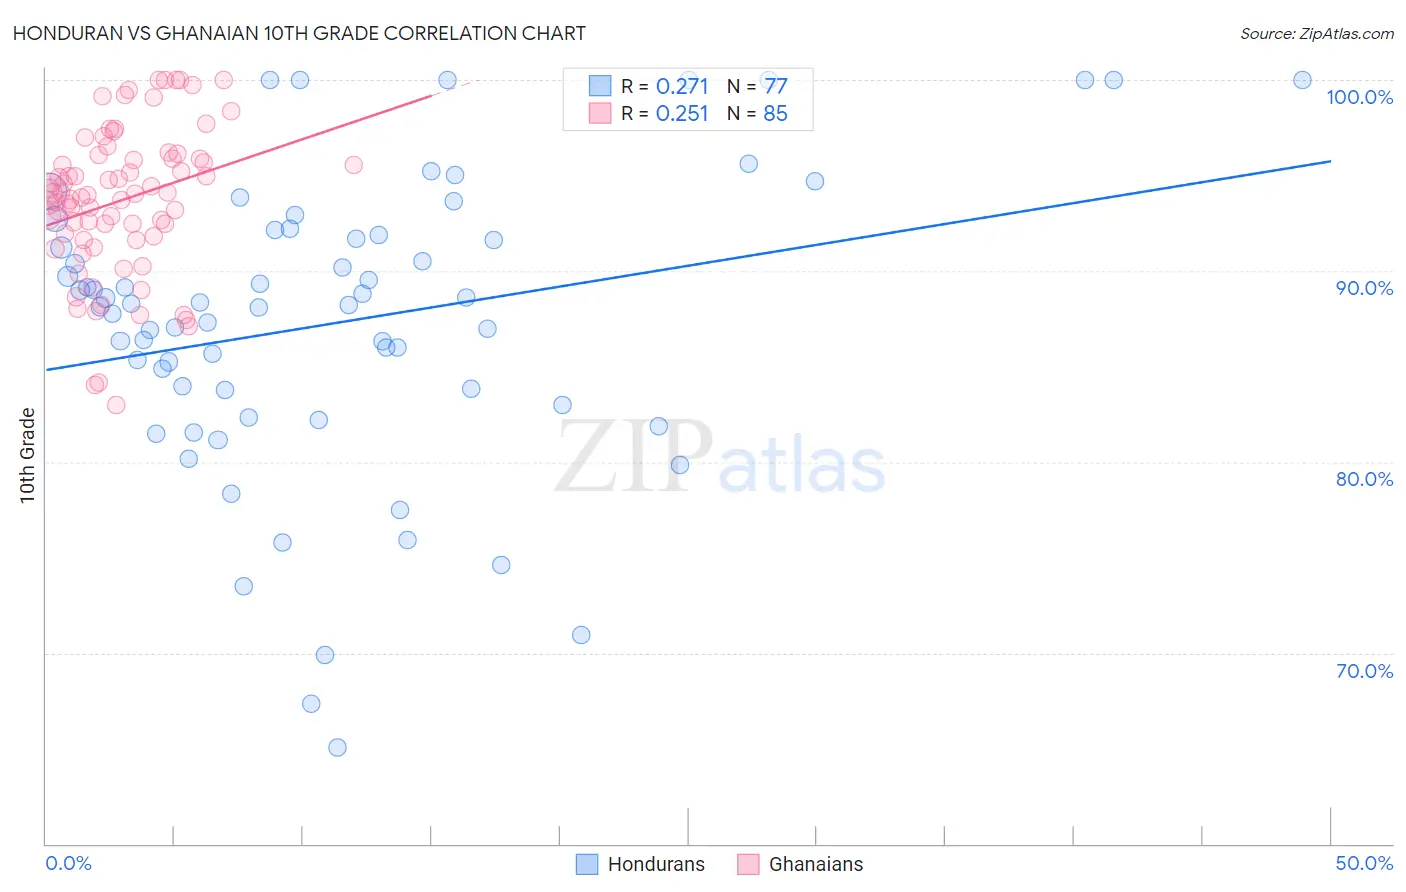
Honduran vs Ghanaian 10th Grade Correlation Chart
The statistical analysis conducted on geographies consisting of 357,858,827 people shows a weak positive correlation between the proportion of Hondurans and percentage of population with at least 10th grade education in the United States with a correlation coefficient (R) of 0.271 and weighted average of 89.0%. Similarly, the statistical analysis conducted on geographies consisting of 190,714,671 people shows a weak positive correlation between the proportion of Ghanaians and percentage of population with at least 10th grade education in the United States with a correlation coefficient (R) of 0.251 and weighted average of 92.8%, a difference of 4.3%.
10th Grade Correlation Summary
| Measurement | Honduran | Ghanaian |
| Minimum | 65.0% | 83.0% |
| Maximum | 100.0% | 100.0% |
| Range | 35.0% | 17.0% |
| Mean | 87.3% | 93.7% |
| Median | 88.2% | 94.1% |
| Interquartile 25% (IQ1) | 83.4% | 91.7% |
| Interquartile 75% (IQ3) | 92.0% | 96.0% |
| Interquartile Range (IQR) | 8.6% | 4.3% |
| Standard Deviation (Sample) | 7.7% | 3.8% |
| Standard Deviation (Population) | 7.7% | 3.8% |
Similar Demographics by 10th Grade
Demographics Similar to Hondurans by 10th Grade
In terms of 10th grade, the demographic groups most similar to Hondurans are Immigrants from the Azores (89.0%, a difference of 0.030%), Mexican American Indian (89.0%, a difference of 0.070%), Immigrants from Yemen (89.1%, a difference of 0.10%), Hispanic or Latino (88.9%, a difference of 0.12%), and Immigrants from Dominican Republic (88.7%, a difference of 0.30%).
| Demographics | Rating | Rank | 10th Grade |
| Central American Indians | 0.0 /100 | #326 | Tragic 89.7% |
| Immigrants | Nicaragua | 0.0 /100 | #327 | Tragic 89.5% |
| Immigrants | Cabo Verde | 0.0 /100 | #328 | Tragic 89.5% |
| Dominicans | 0.0 /100 | #329 | Tragic 89.4% |
| Immigrants | Yemen | 0.0 /100 | #330 | Tragic 89.1% |
| Mexican American Indians | 0.0 /100 | #331 | Tragic 89.0% |
| Immigrants | Azores | 0.0 /100 | #332 | Tragic 89.0% |
| Hondurans | 0.0 /100 | #333 | Tragic 89.0% |
| Hispanics or Latinos | 0.0 /100 | #334 | Tragic 88.9% |
| Immigrants | Dominican Republic | 0.0 /100 | #335 | Tragic 88.7% |
| Immigrants | Honduras | 0.0 /100 | #336 | Tragic 88.5% |
| Central Americans | 0.0 /100 | #337 | Tragic 88.4% |
| Immigrants | Latin America | 0.0 /100 | #338 | Tragic 88.3% |
| Guatemalans | 0.0 /100 | #339 | Tragic 87.9% |
| Mexicans | 0.0 /100 | #340 | Tragic 87.8% |
Demographics Similar to Ghanaians by 10th Grade
In terms of 10th grade, the demographic groups most similar to Ghanaians are South American (92.8%, a difference of 0.0%), Immigrants from Thailand (92.8%, a difference of 0.010%), Armenian (92.7%, a difference of 0.010%), Jamaican (92.8%, a difference of 0.060%), and Immigrants from Bolivia (92.7%, a difference of 0.060%).
| Demographics | Rating | Rank | 10th Grade |
| Immigrants | Middle Africa | 1.7 /100 | #246 | Tragic 92.9% |
| Immigrants | Afghanistan | 1.4 /100 | #247 | Tragic 92.8% |
| Colombians | 1.4 /100 | #248 | Tragic 92.8% |
| Immigrants | Senegal | 1.4 /100 | #249 | Tragic 92.8% |
| Jamaicans | 1.2 /100 | #250 | Tragic 92.8% |
| Immigrants | Thailand | 1.0 /100 | #251 | Tragic 92.8% |
| South Americans | 0.9 /100 | #252 | Tragic 92.8% |
| Ghanaians | 0.9 /100 | #253 | Tragic 92.8% |
| Armenians | 0.9 /100 | #254 | Tragic 92.7% |
| Immigrants | Bolivia | 0.7 /100 | #255 | Tragic 92.7% |
| Immigrants | Nigeria | 0.7 /100 | #256 | Tragic 92.7% |
| U.S. Virgin Islanders | 0.7 /100 | #257 | Tragic 92.7% |
| Immigrants | Costa Rica | 0.6 /100 | #258 | Tragic 92.7% |
| Immigrants | Jamaica | 0.5 /100 | #259 | Tragic 92.6% |
| Immigrants | Uzbekistan | 0.5 /100 | #260 | Tragic 92.6% |