Cypriot vs Immigrants from Eritrea Master's Degree
COMPARE
Cypriot
Immigrants from Eritrea
Master's Degree
Master's Degree Comparison
Cypriots
Immigrants from Eritrea
21.8%
MASTER'S DEGREE
100.0/ 100
METRIC RATING
8th/ 347
METRIC RANK
16.4%
MASTER'S DEGREE
95.5/ 100
METRIC RATING
124th/ 347
METRIC RANK
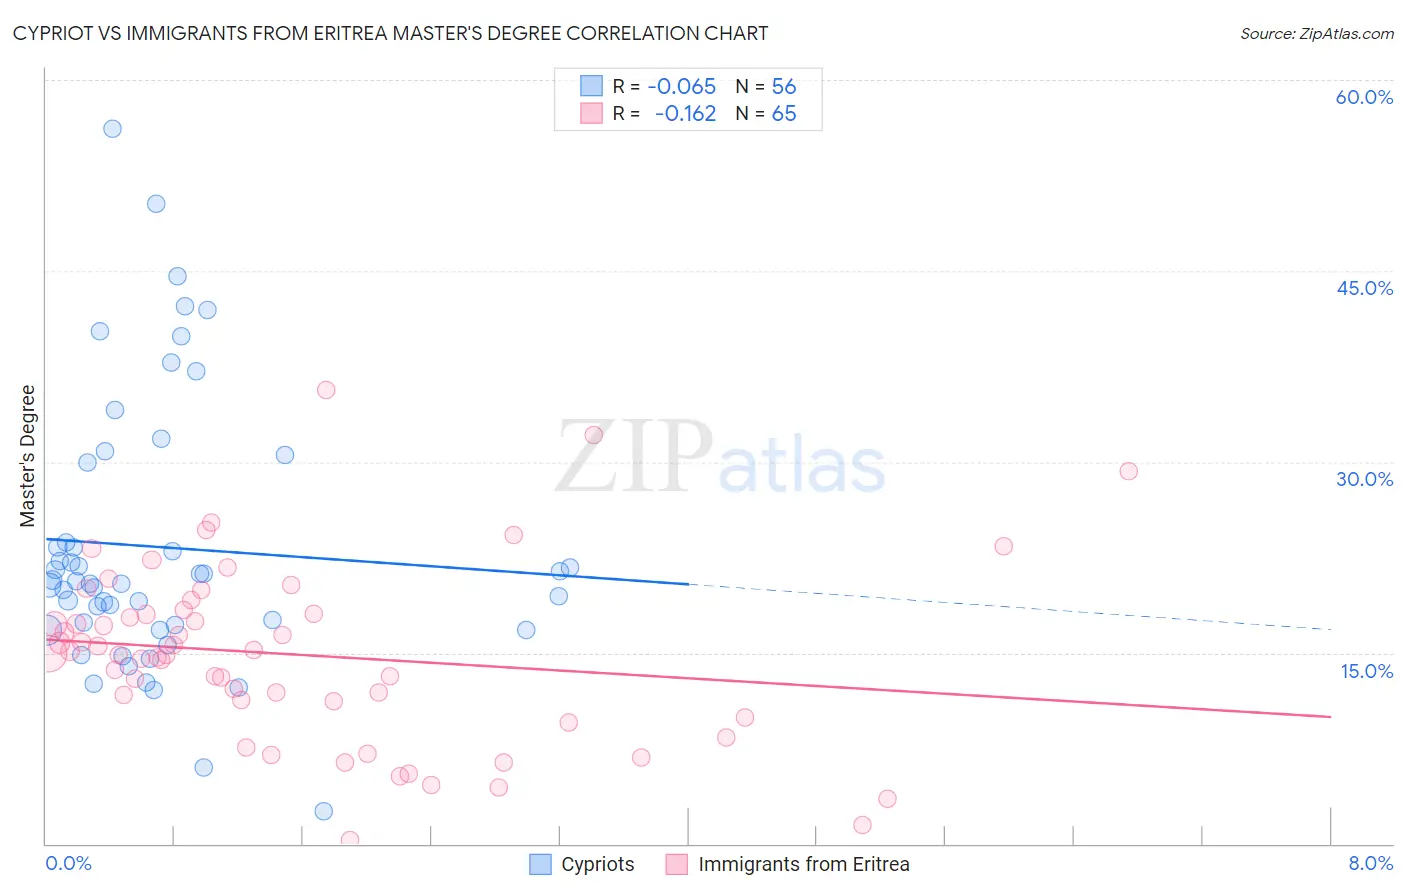
Cypriot vs Immigrants from Eritrea Master's Degree Correlation Chart
The statistical analysis conducted on geographies consisting of 61,862,826 people shows a slight negative correlation between the proportion of Cypriots and percentage of population with at least master's degree education in the United States with a correlation coefficient (R) of -0.065 and weighted average of 21.8%. Similarly, the statistical analysis conducted on geographies consisting of 104,847,630 people shows a poor negative correlation between the proportion of Immigrants from Eritrea and percentage of population with at least master's degree education in the United States with a correlation coefficient (R) of -0.162 and weighted average of 16.4%, a difference of 33.1%.
Master's Degree Correlation Summary
| Measurement | Cypriot | Immigrants from Eritrea |
| Minimum | 2.5% | 0.25% |
| Maximum | 56.1% | 35.6% |
| Range | 53.6% | 35.4% |
| Mean | 23.3% | 14.8% |
| Median | 20.5% | 15.0% |
| Interquartile 25% (IQ1) | 17.0% | 10.6% |
| Interquartile 75% (IQ3) | 26.8% | 18.2% |
| Interquartile Range (IQR) | 9.8% | 7.6% |
| Standard Deviation (Sample) | 10.7% | 7.0% |
| Standard Deviation (Population) | 10.6% | 7.0% |
Similar Demographics by Master's Degree
Demographics Similar to Cypriots by Master's Degree
In terms of master's degree, the demographic groups most similar to Cypriots are Thai (21.7%, a difference of 0.34%), Immigrants from Iran (21.6%, a difference of 0.75%), Iranian (22.3%, a difference of 2.2%), Immigrants from India (22.3%, a difference of 2.4%), and Immigrants from China (21.2%, a difference of 2.9%).
| Demographics | Rating | Rank | Master's Degree |
| Immigrants | Singapore | 100.0 /100 | #1 | Exceptional 23.4% |
| Filipinos | 100.0 /100 | #2 | Exceptional 23.4% |
| Immigrants | Israel | 100.0 /100 | #3 | Exceptional 22.6% |
| Okinawans | 100.0 /100 | #4 | Exceptional 22.6% |
| Immigrants | Taiwan | 100.0 /100 | #5 | Exceptional 22.5% |
| Immigrants | India | 100.0 /100 | #6 | Exceptional 22.3% |
| Iranians | 100.0 /100 | #7 | Exceptional 22.3% |
| Cypriots | 100.0 /100 | #8 | Exceptional 21.8% |
| Thais | 100.0 /100 | #9 | Exceptional 21.7% |
| Immigrants | Iran | 100.0 /100 | #10 | Exceptional 21.6% |
| Immigrants | China | 100.0 /100 | #11 | Exceptional 21.2% |
| Eastern Europeans | 100.0 /100 | #12 | Exceptional 21.1% |
| Immigrants | Australia | 100.0 /100 | #13 | Exceptional 20.9% |
| Immigrants | Switzerland | 100.0 /100 | #14 | Exceptional 20.9% |
| Immigrants | Eastern Asia | 100.0 /100 | #15 | Exceptional 20.8% |
Demographics Similar to Immigrants from Eritrea by Master's Degree
In terms of master's degree, the demographic groups most similar to Immigrants from Eritrea are Croatian (16.4%, a difference of 0.070%), Italian (16.4%, a difference of 0.070%), British (16.4%, a difference of 0.080%), Immigrants from Eastern Africa (16.3%, a difference of 0.19%), and Palestinian (16.3%, a difference of 0.45%).
| Demographics | Rating | Rank | Master's Degree |
| Immigrants | Moldova | 97.2 /100 | #117 | Exceptional 16.6% |
| Brazilians | 96.8 /100 | #118 | Exceptional 16.5% |
| Jordanians | 96.5 /100 | #119 | Exceptional 16.5% |
| Lebanese | 96.4 /100 | #120 | Exceptional 16.5% |
| Afghans | 96.2 /100 | #121 | Exceptional 16.5% |
| British | 95.6 /100 | #122 | Exceptional 16.4% |
| Croatians | 95.6 /100 | #123 | Exceptional 16.4% |
| Immigrants | Eritrea | 95.5 /100 | #124 | Exceptional 16.4% |
| Italians | 95.4 /100 | #125 | Exceptional 16.4% |
| Immigrants | Eastern Africa | 95.2 /100 | #126 | Exceptional 16.3% |
| Palestinians | 94.8 /100 | #127 | Exceptional 16.3% |
| Immigrants | Sierra Leone | 94.7 /100 | #128 | Exceptional 16.3% |
| Immigrants | Syria | 93.3 /100 | #129 | Exceptional 16.2% |
| Immigrants | Jordan | 92.7 /100 | #130 | Exceptional 16.1% |
| Taiwanese | 91.9 /100 | #131 | Exceptional 16.1% |