Nigerian vs Immigrants from Eritrea Master's Degree
COMPARE
Nigerian
Immigrants from Eritrea
Master's Degree
Master's Degree Comparison
Nigerians
Immigrants from Eritrea
14.9%
MASTER'S DEGREE
48.6/ 100
METRIC RATING
176th/ 347
METRIC RANK
16.4%
MASTER'S DEGREE
95.5/ 100
METRIC RATING
124th/ 347
METRIC RANK
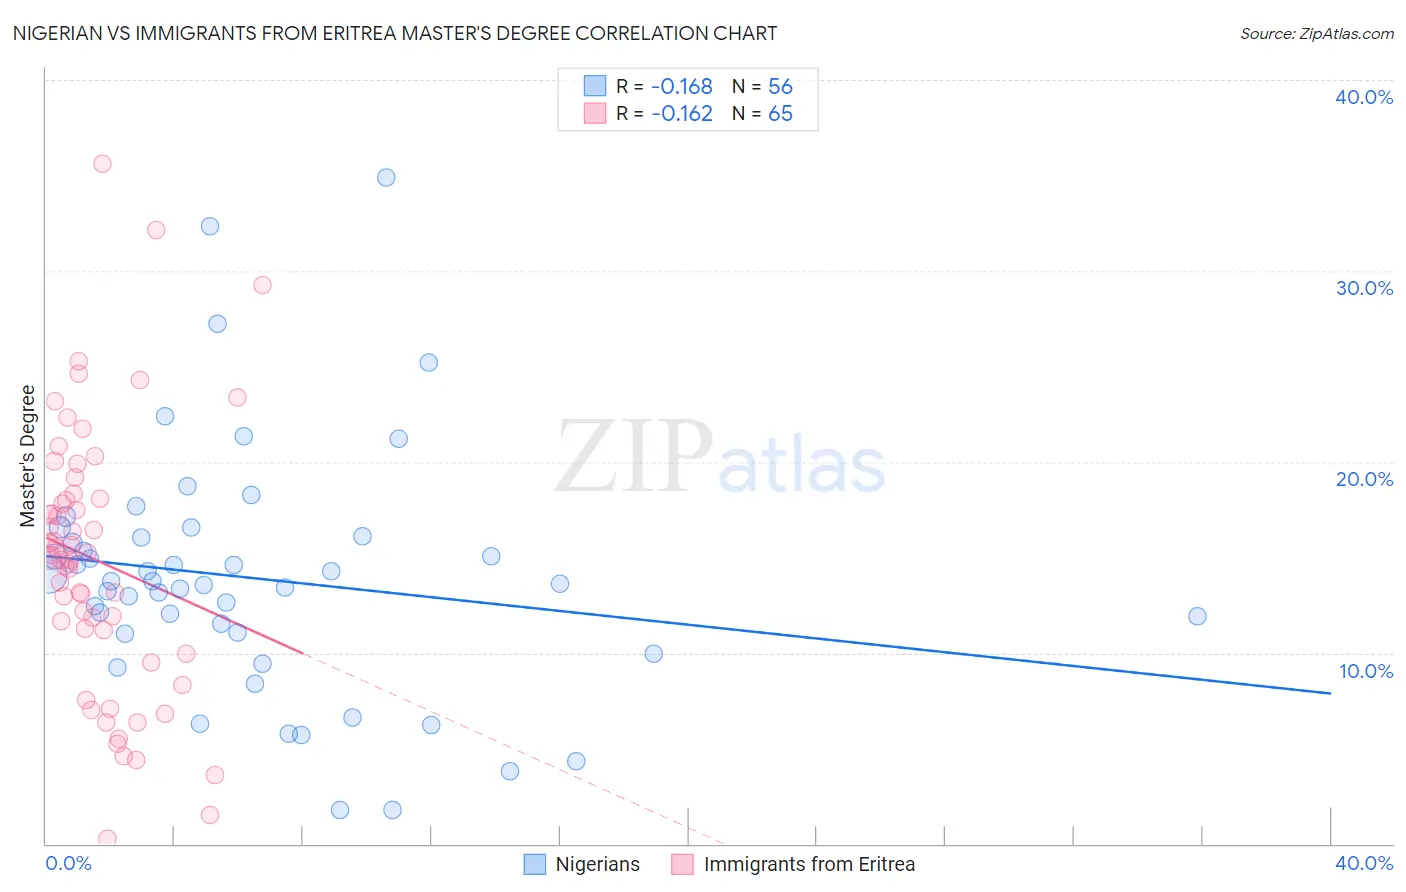
Nigerian vs Immigrants from Eritrea Master's Degree Correlation Chart
The statistical analysis conducted on geographies consisting of 332,630,518 people shows a poor negative correlation between the proportion of Nigerians and percentage of population with at least master's degree education in the United States with a correlation coefficient (R) of -0.168 and weighted average of 14.9%. Similarly, the statistical analysis conducted on geographies consisting of 104,847,630 people shows a poor negative correlation between the proportion of Immigrants from Eritrea and percentage of population with at least master's degree education in the United States with a correlation coefficient (R) of -0.162 and weighted average of 16.4%, a difference of 10.0%.
Master's Degree Correlation Summary
| Measurement | Nigerian | Immigrants from Eritrea |
| Minimum | 1.8% | 0.25% |
| Maximum | 34.9% | 35.6% |
| Range | 33.2% | 35.4% |
| Mean | 13.9% | 14.8% |
| Median | 13.7% | 15.0% |
| Interquartile 25% (IQ1) | 11.0% | 10.6% |
| Interquartile 75% (IQ3) | 16.1% | 18.2% |
| Interquartile Range (IQR) | 5.0% | 7.6% |
| Standard Deviation (Sample) | 6.5% | 7.0% |
| Standard Deviation (Population) | 6.4% | 7.0% |
Similar Demographics by Master's Degree
Demographics Similar to Nigerians by Master's Degree
In terms of master's degree, the demographic groups most similar to Nigerians are Immigrants from Colombia (14.9%, a difference of 0.030%), Immigrants from Peru (14.9%, a difference of 0.14%), Slovak (14.9%, a difference of 0.18%), English (14.8%, a difference of 0.47%), and Costa Rican (15.0%, a difference of 0.50%).
| Demographics | Rating | Rank | Master's Degree |
| Scottish | 62.7 /100 | #169 | Good 15.2% |
| Irish | 56.3 /100 | #170 | Average 15.0% |
| Immigrants | Ghana | 53.6 /100 | #171 | Average 15.0% |
| Immigrants | Uruguay | 52.8 /100 | #172 | Average 15.0% |
| Costa Ricans | 52.5 /100 | #173 | Average 15.0% |
| Slovaks | 50.0 /100 | #174 | Average 14.9% |
| Immigrants | Peru | 49.6 /100 | #175 | Average 14.9% |
| Nigerians | 48.6 /100 | #176 | Average 14.9% |
| Immigrants | Colombia | 48.3 /100 | #177 | Average 14.9% |
| English | 45.0 /100 | #178 | Average 14.8% |
| Immigrants | Iraq | 41.3 /100 | #179 | Average 14.8% |
| Celtics | 41.3 /100 | #180 | Average 14.8% |
| Swiss | 41.1 /100 | #181 | Average 14.7% |
| Czechs | 40.4 /100 | #182 | Average 14.7% |
| Sri Lankans | 39.6 /100 | #183 | Fair 14.7% |
Demographics Similar to Immigrants from Eritrea by Master's Degree
In terms of master's degree, the demographic groups most similar to Immigrants from Eritrea are Croatian (16.4%, a difference of 0.070%), Italian (16.4%, a difference of 0.070%), British (16.4%, a difference of 0.080%), Immigrants from Eastern Africa (16.3%, a difference of 0.19%), and Palestinian (16.3%, a difference of 0.45%).
| Demographics | Rating | Rank | Master's Degree |
| Immigrants | Moldova | 97.2 /100 | #117 | Exceptional 16.6% |
| Brazilians | 96.8 /100 | #118 | Exceptional 16.5% |
| Jordanians | 96.5 /100 | #119 | Exceptional 16.5% |
| Lebanese | 96.4 /100 | #120 | Exceptional 16.5% |
| Afghans | 96.2 /100 | #121 | Exceptional 16.5% |
| British | 95.6 /100 | #122 | Exceptional 16.4% |
| Croatians | 95.6 /100 | #123 | Exceptional 16.4% |
| Immigrants | Eritrea | 95.5 /100 | #124 | Exceptional 16.4% |
| Italians | 95.4 /100 | #125 | Exceptional 16.4% |
| Immigrants | Eastern Africa | 95.2 /100 | #126 | Exceptional 16.3% |
| Palestinians | 94.8 /100 | #127 | Exceptional 16.3% |
| Immigrants | Sierra Leone | 94.7 /100 | #128 | Exceptional 16.3% |
| Immigrants | Syria | 93.3 /100 | #129 | Exceptional 16.2% |
| Immigrants | Jordan | 92.7 /100 | #130 | Exceptional 16.1% |
| Taiwanese | 91.9 /100 | #131 | Exceptional 16.1% |