Honduran vs Immigrants from Cabo Verde Master's Degree
COMPARE
Honduran
Immigrants from Cabo Verde
Master's Degree
Master's Degree Comparison
Hondurans
Immigrants from Cabo Verde
11.9%
MASTER'S DEGREE
0.2/ 100
METRIC RATING
283rd/ 347
METRIC RANK
11.3%
MASTER'S DEGREE
0.1/ 100
METRIC RATING
304th/ 347
METRIC RANK
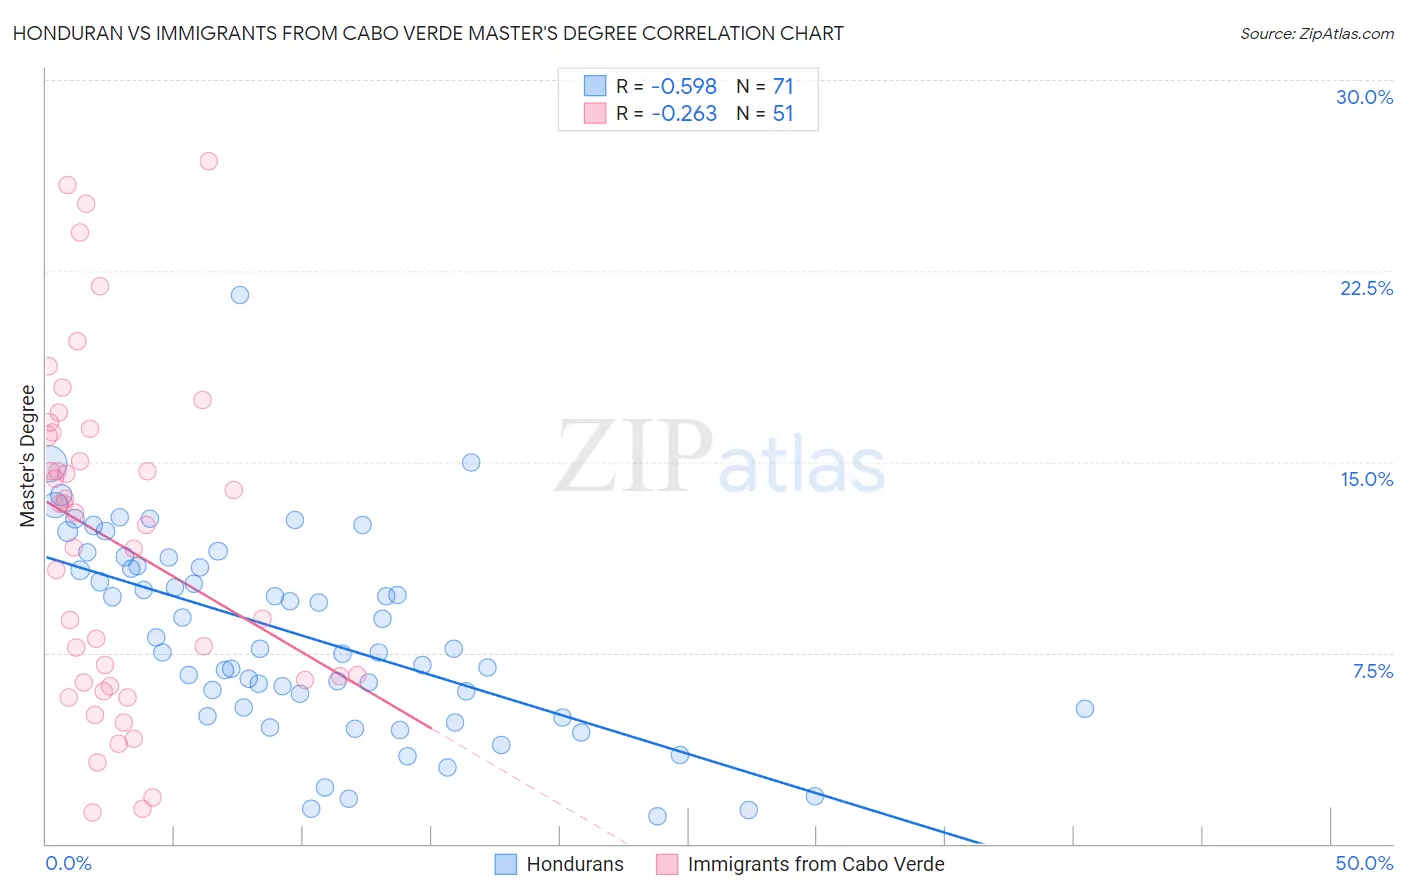
Honduran vs Immigrants from Cabo Verde Master's Degree Correlation Chart
The statistical analysis conducted on geographies consisting of 357,698,981 people shows a substantial negative correlation between the proportion of Hondurans and percentage of population with at least master's degree education in the United States with a correlation coefficient (R) of -0.598 and weighted average of 11.9%. Similarly, the statistical analysis conducted on geographies consisting of 38,158,316 people shows a weak negative correlation between the proportion of Immigrants from Cabo Verde and percentage of population with at least master's degree education in the United States with a correlation coefficient (R) of -0.263 and weighted average of 11.3%, a difference of 5.3%.
Master's Degree Correlation Summary
| Measurement | Honduran | Immigrants from Cabo Verde |
| Minimum | 1.1% | 1.2% |
| Maximum | 21.5% | 26.8% |
| Range | 20.4% | 25.5% |
| Mean | 8.2% | 11.9% |
| Median | 7.6% | 12.5% |
| Interquartile 25% (IQ1) | 5.3% | 6.3% |
| Interquartile 75% (IQ3) | 10.9% | 16.1% |
| Interquartile Range (IQR) | 5.6% | 9.8% |
| Standard Deviation (Sample) | 3.9% | 6.6% |
| Standard Deviation (Population) | 3.9% | 6.5% |
Similar Demographics by Master's Degree
Demographics Similar to Hondurans by Master's Degree
In terms of master's degree, the demographic groups most similar to Hondurans are Immigrants from El Salvador (12.0%, a difference of 0.41%), Malaysian (12.0%, a difference of 0.72%), Ottawa (11.9%, a difference of 0.72%), Immigrants from Dominican Republic (12.1%, a difference of 0.85%), and Immigrants from Belize (12.1%, a difference of 0.90%).
| Demographics | Rating | Rank | Master's Degree |
| Blacks/African Americans | 0.3 /100 | #276 | Tragic 12.1% |
| Immigrants | Caribbean | 0.3 /100 | #277 | Tragic 12.1% |
| Potawatomi | 0.3 /100 | #278 | Tragic 12.1% |
| Immigrants | Belize | 0.2 /100 | #279 | Tragic 12.1% |
| Immigrants | Dominican Republic | 0.2 /100 | #280 | Tragic 12.1% |
| Malaysians | 0.2 /100 | #281 | Tragic 12.0% |
| Immigrants | El Salvador | 0.2 /100 | #282 | Tragic 12.0% |
| Hondurans | 0.2 /100 | #283 | Tragic 11.9% |
| Ottawa | 0.2 /100 | #284 | Tragic 11.9% |
| Immigrants | Nicaragua | 0.2 /100 | #285 | Tragic 11.8% |
| Aleuts | 0.1 /100 | #286 | Tragic 11.8% |
| Immigrants | Haiti | 0.1 /100 | #287 | Tragic 11.8% |
| Immigrants | Honduras | 0.1 /100 | #288 | Tragic 11.8% |
| Guatemalans | 0.1 /100 | #289 | Tragic 11.7% |
| Ute | 0.1 /100 | #290 | Tragic 11.7% |
Demographics Similar to Immigrants from Cabo Verde by Master's Degree
In terms of master's degree, the demographic groups most similar to Immigrants from Cabo Verde are Immigrants from Laos (11.4%, a difference of 0.19%), Cherokee (11.4%, a difference of 0.21%), Tsimshian (11.4%, a difference of 0.52%), Immigrants from Latin America (11.3%, a difference of 0.65%), and Chippewa (11.4%, a difference of 0.68%).
| Demographics | Rating | Rank | Master's Degree |
| Immigrants | Yemen | 0.1 /100 | #297 | Tragic 11.6% |
| Samoans | 0.1 /100 | #298 | Tragic 11.5% |
| Chickasaw | 0.1 /100 | #299 | Tragic 11.4% |
| Chippewa | 0.1 /100 | #300 | Tragic 11.4% |
| Tsimshian | 0.1 /100 | #301 | Tragic 11.4% |
| Cherokee | 0.1 /100 | #302 | Tragic 11.4% |
| Immigrants | Laos | 0.1 /100 | #303 | Tragic 11.4% |
| Immigrants | Cabo Verde | 0.1 /100 | #304 | Tragic 11.3% |
| Immigrants | Latin America | 0.0 /100 | #305 | Tragic 11.3% |
| Mexican American Indians | 0.0 /100 | #306 | Tragic 11.2% |
| Cheyenne | 0.0 /100 | #307 | Tragic 11.2% |
| Puerto Ricans | 0.0 /100 | #308 | Tragic 11.2% |
| Puget Sound Salish | 0.0 /100 | #309 | Tragic 11.1% |
| Shoshone | 0.0 /100 | #310 | Tragic 11.1% |
| Seminole | 0.0 /100 | #311 | Tragic 11.0% |