Honduran vs African Per Capita Income
COMPARE
Honduran
African
Per Capita Income
Per Capita Income Comparison
Hondurans
Africans
$37,031
PER CAPITA INCOME
0.1/ 100
METRIC RATING
304th/ 347
METRIC RANK
$37,785
PER CAPITA INCOME
0.1/ 100
METRIC RATING
284th/ 347
METRIC RANK
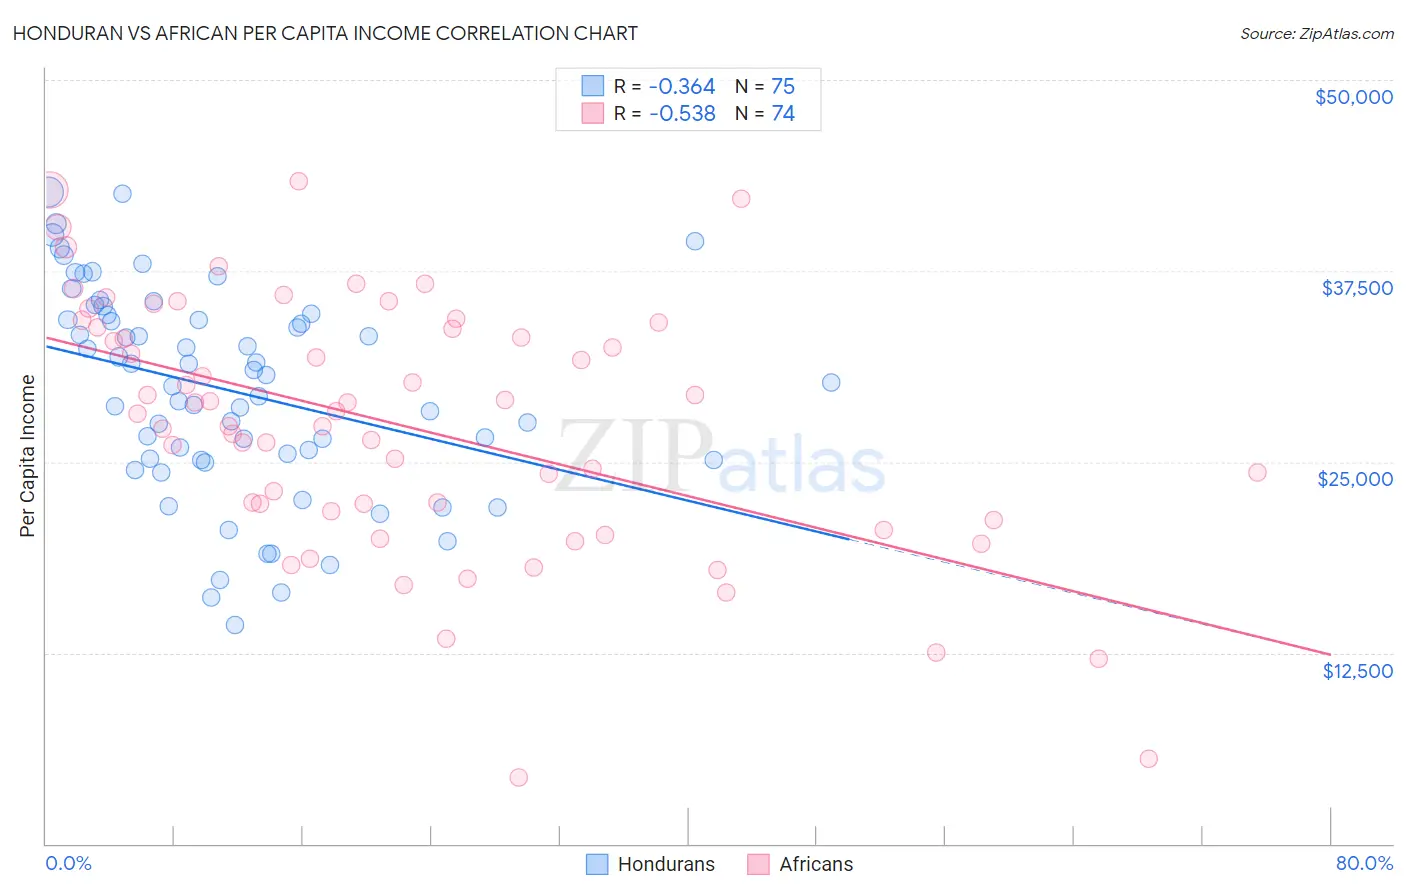
Honduran vs African Per Capita Income Correlation Chart
The statistical analysis conducted on geographies consisting of 357,835,074 people shows a mild negative correlation between the proportion of Hondurans and per capita income in the United States with a correlation coefficient (R) of -0.364 and weighted average of $37,031. Similarly, the statistical analysis conducted on geographies consisting of 470,145,104 people shows a substantial negative correlation between the proportion of Africans and per capita income in the United States with a correlation coefficient (R) of -0.538 and weighted average of $37,785, a difference of 2.0%.
Per Capita Income Correlation Summary
| Measurement | Honduran | African |
| Minimum | $14,358 | $4,302 |
| Maximum | $42,674 | $43,354 |
| Range | $28,316 | $39,052 |
| Mean | $29,671 | $27,384 |
| Median | $30,191 | $28,229 |
| Interquartile 25% (IQ1) | $25,099 | $21,779 |
| Interquartile 75% (IQ3) | $34,632 | $33,791 |
| Interquartile Range (IQR) | $9,533 | $12,012 |
| Standard Deviation (Sample) | $6,736 | $8,322 |
| Standard Deviation (Population) | $6,690 | $8,265 |
Demographics Similar to Hondurans and Africans by Per Capita Income
In terms of per capita income, the demographic groups most similar to Hondurans are Paiute ($37,066, a difference of 0.090%), Shoshone ($37,072, a difference of 0.11%), Ottawa ($37,101, a difference of 0.19%), Immigrants from Bahamas ($37,193, a difference of 0.44%), and Cherokee ($37,203, a difference of 0.47%). Similarly, the demographic groups most similar to Africans are Guatemalan ($37,766, a difference of 0.050%), Central American Indian ($37,699, a difference of 0.23%), Dominican ($37,697, a difference of 0.24%), Blackfeet ($37,695, a difference of 0.24%), and U.S. Virgin Islander ($37,589, a difference of 0.52%).
| Demographics | Rating | Rank | Per Capita Income |
| Africans | 0.1 /100 | #284 | Tragic $37,785 |
| Guatemalans | 0.1 /100 | #285 | Tragic $37,766 |
| Central American Indians | 0.1 /100 | #286 | Tragic $37,699 |
| Dominicans | 0.1 /100 | #287 | Tragic $37,697 |
| Blackfeet | 0.1 /100 | #288 | Tragic $37,695 |
| U.S. Virgin Islanders | 0.1 /100 | #289 | Tragic $37,589 |
| Immigrants | Guatemala | 0.1 /100 | #290 | Tragic $37,550 |
| Cajuns | 0.1 /100 | #291 | Tragic $37,527 |
| Immigrants | Micronesia | 0.1 /100 | #292 | Tragic $37,464 |
| Mexican American Indians | 0.1 /100 | #293 | Tragic $37,407 |
| Cubans | 0.1 /100 | #294 | Tragic $37,383 |
| Immigrants | Dominican Republic | 0.1 /100 | #295 | Tragic $37,306 |
| Indonesians | 0.1 /100 | #296 | Tragic $37,300 |
| Haitians | 0.1 /100 | #297 | Tragic $37,289 |
| Immigrants | Caribbean | 0.1 /100 | #298 | Tragic $37,254 |
| Cherokee | 0.1 /100 | #299 | Tragic $37,203 |
| Immigrants | Bahamas | 0.1 /100 | #300 | Tragic $37,193 |
| Ottawa | 0.1 /100 | #301 | Tragic $37,101 |
| Shoshone | 0.1 /100 | #302 | Tragic $37,072 |
| Paiute | 0.1 /100 | #303 | Tragic $37,066 |
| Hondurans | 0.1 /100 | #304 | Tragic $37,031 |