Czechoslovakian vs Immigrants from China 11th Grade
COMPARE
Czechoslovakian
Immigrants from China
11th Grade
11th Grade Comparison
Czechoslovakians
Immigrants from China
94.0%
11TH GRADE
99.9/ 100
METRIC RATING
55th/ 347
METRIC RANK
92.3%
11TH GRADE
25.1/ 100
METRIC RATING
201st/ 347
METRIC RANK
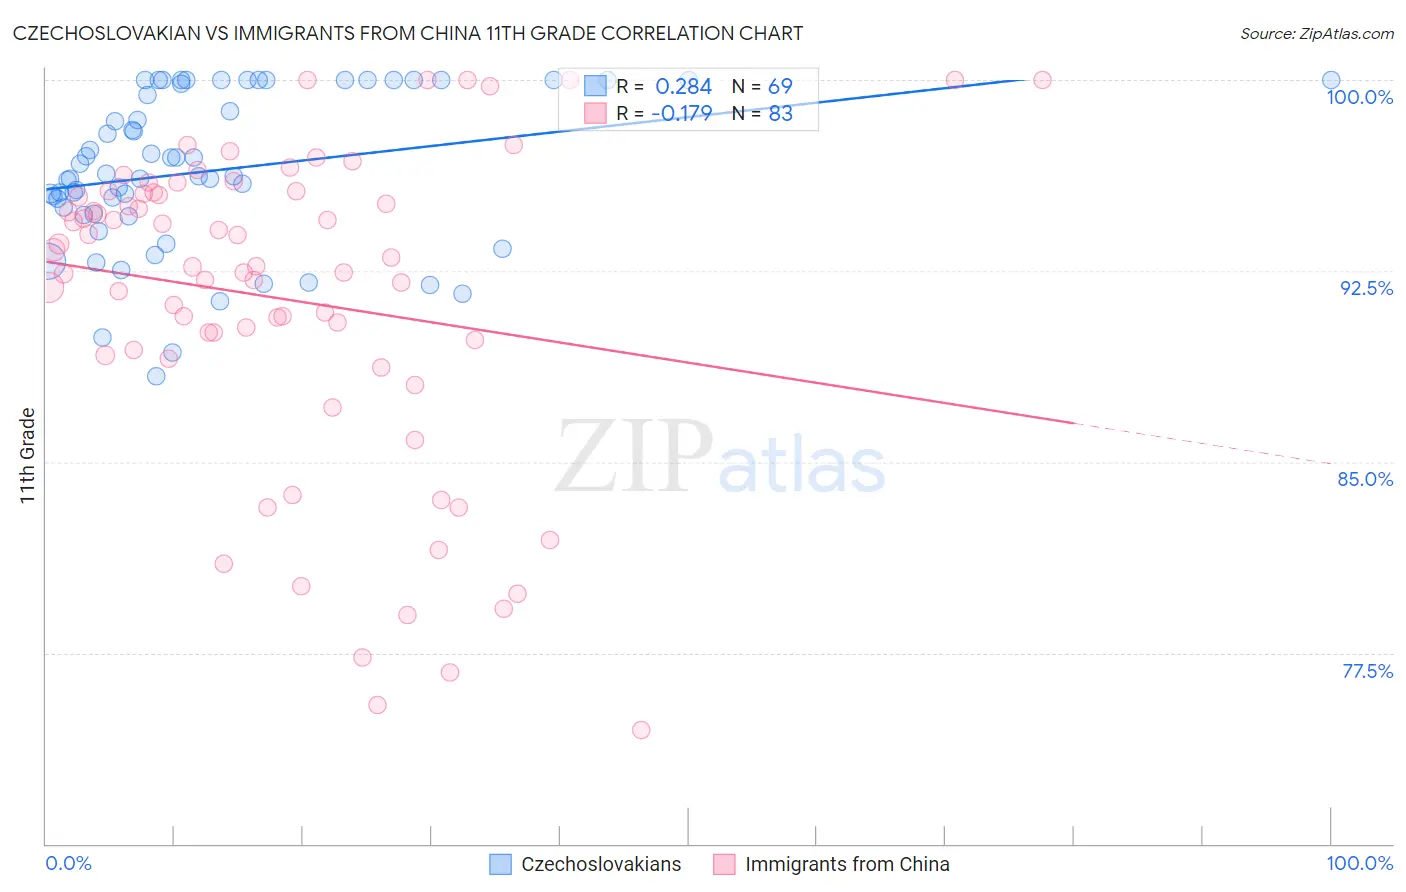
Czechoslovakian vs Immigrants from China 11th Grade Correlation Chart
The statistical analysis conducted on geographies consisting of 368,668,876 people shows a weak positive correlation between the proportion of Czechoslovakians and percentage of population with at least 11th grade education in the United States with a correlation coefficient (R) of 0.284 and weighted average of 94.0%. Similarly, the statistical analysis conducted on geographies consisting of 457,082,957 people shows a poor negative correlation between the proportion of Immigrants from China and percentage of population with at least 11th grade education in the United States with a correlation coefficient (R) of -0.179 and weighted average of 92.3%, a difference of 1.9%.
11th Grade Correlation Summary
| Measurement | Czechoslovakian | Immigrants from China |
| Minimum | 88.3% | 74.5% |
| Maximum | 100.0% | 100.0% |
| Range | 11.7% | 25.5% |
| Mean | 96.4% | 91.4% |
| Median | 96.2% | 92.7% |
| Interquartile 25% (IQ1) | 94.7% | 89.2% |
| Interquartile 75% (IQ3) | 100.0% | 95.6% |
| Interquartile Range (IQR) | 5.3% | 6.4% |
| Standard Deviation (Sample) | 3.1% | 6.3% |
| Standard Deviation (Population) | 3.0% | 6.3% |
Similar Demographics by 11th Grade
Demographics Similar to Czechoslovakians by 11th Grade
In terms of 11th grade, the demographic groups most similar to Czechoslovakians are Immigrants from North America (94.0%, a difference of 0.0%), Immigrants from Australia (94.0%, a difference of 0.010%), French Canadian (94.0%, a difference of 0.010%), New Zealander (94.0%, a difference of 0.010%), and Iranian (94.0%, a difference of 0.010%).
| Demographics | Rating | Rank | 11th Grade |
| Macedonians | 99.9 /100 | #48 | Exceptional 94.1% |
| Slavs | 99.9 /100 | #49 | Exceptional 94.1% |
| French | 99.9 /100 | #50 | Exceptional 94.1% |
| Turks | 99.9 /100 | #51 | Exceptional 94.0% |
| Immigrants | Canada | 99.9 /100 | #52 | Exceptional 94.0% |
| Immigrants | Australia | 99.9 /100 | #53 | Exceptional 94.0% |
| Immigrants | North America | 99.9 /100 | #54 | Exceptional 94.0% |
| Czechoslovakians | 99.9 /100 | #55 | Exceptional 94.0% |
| French Canadians | 99.9 /100 | #56 | Exceptional 94.0% |
| New Zealanders | 99.9 /100 | #57 | Exceptional 94.0% |
| Iranians | 99.9 /100 | #58 | Exceptional 94.0% |
| Bhutanese | 99.8 /100 | #59 | Exceptional 94.0% |
| Okinawans | 99.8 /100 | #60 | Exceptional 94.0% |
| Immigrants | Belgium | 99.8 /100 | #61 | Exceptional 94.0% |
| Austrians | 99.8 /100 | #62 | Exceptional 94.0% |
Demographics Similar to Immigrants from China by 11th Grade
In terms of 11th grade, the demographic groups most similar to Immigrants from China are Immigrants from Uganda (92.3%, a difference of 0.0%), Samoan (92.3%, a difference of 0.0%), Marshallese (92.3%, a difference of 0.010%), Hawaiian (92.3%, a difference of 0.010%), and Immigrants from Eastern Africa (92.3%, a difference of 0.010%).
| Demographics | Rating | Rank | 11th Grade |
| Sioux | 28.5 /100 | #194 | Fair 92.3% |
| Liberians | 26.8 /100 | #195 | Fair 92.3% |
| Panamanians | 26.4 /100 | #196 | Fair 92.3% |
| Marshallese | 26.0 /100 | #197 | Fair 92.3% |
| Hawaiians | 25.5 /100 | #198 | Fair 92.3% |
| Immigrants | Uganda | 25.2 /100 | #199 | Fair 92.3% |
| Samoans | 25.1 /100 | #200 | Fair 92.3% |
| Immigrants | China | 25.1 /100 | #201 | Fair 92.3% |
| Immigrants | Eastern Africa | 24.1 /100 | #202 | Fair 92.3% |
| Immigrants | Sudan | 23.5 /100 | #203 | Fair 92.3% |
| Immigrants | Hong Kong | 23.3 /100 | #204 | Fair 92.2% |
| Kiowa | 23.2 /100 | #205 | Fair 92.2% |
| Bolivians | 23.2 /100 | #206 | Fair 92.2% |
| Immigrants | Oceania | 22.4 /100 | #207 | Fair 92.2% |
| Colville | 21.8 /100 | #208 | Fair 92.2% |