Immigrants from Latin America vs Immigrants from China 11th Grade
COMPARE
Immigrants from Latin America
Immigrants from China
11th Grade
11th Grade Comparison
Immigrants from Latin America
Immigrants from China
86.8%
11TH GRADE
0.0/ 100
METRIC RATING
338th/ 347
METRIC RANK
92.3%
11TH GRADE
25.1/ 100
METRIC RATING
201st/ 347
METRIC RANK
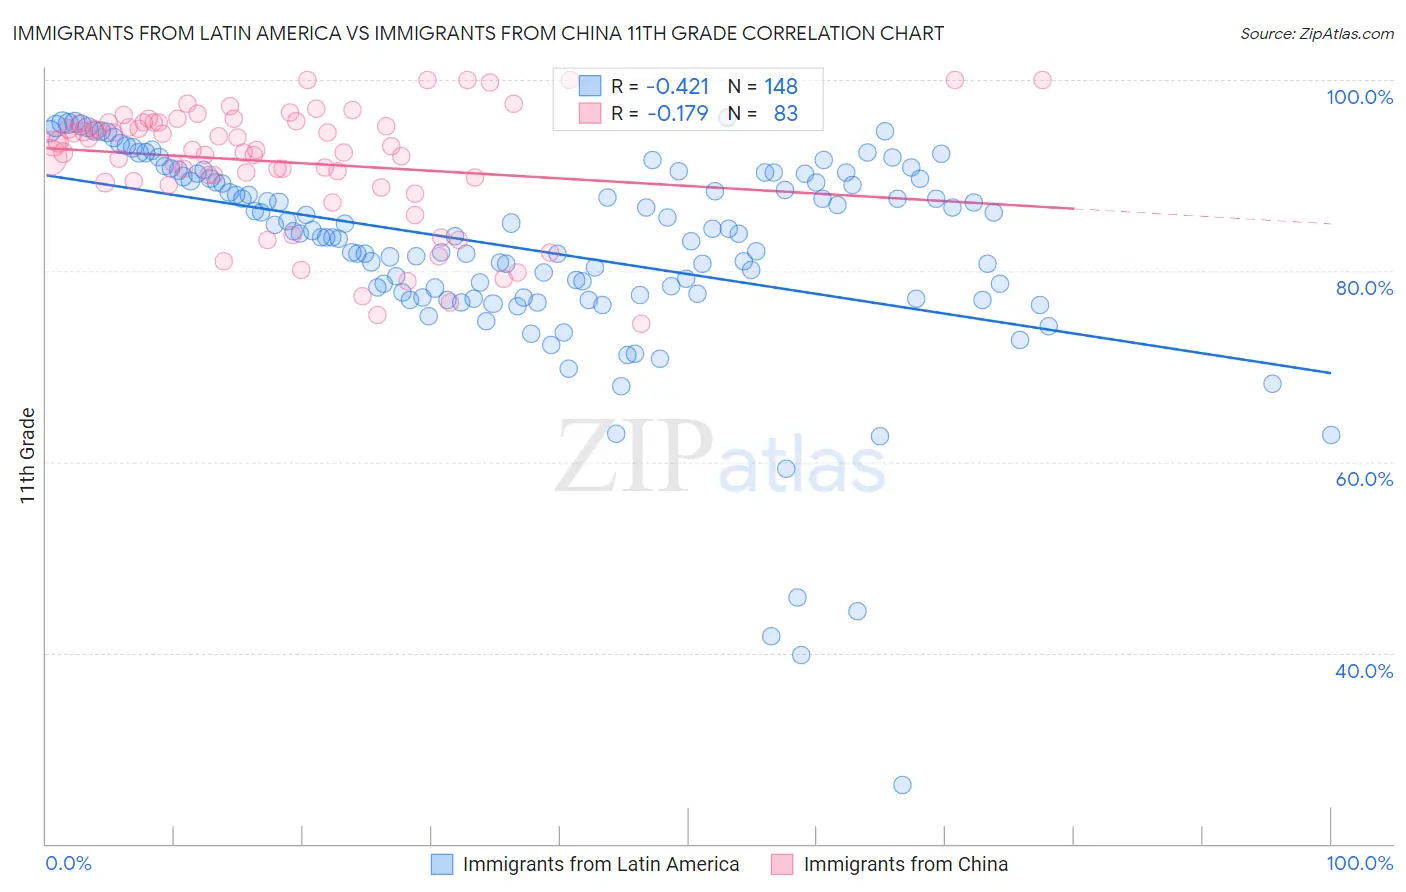
Immigrants from Latin America vs Immigrants from China 11th Grade Correlation Chart
The statistical analysis conducted on geographies consisting of 558,651,329 people shows a moderate negative correlation between the proportion of Immigrants from Latin America and percentage of population with at least 11th grade education in the United States with a correlation coefficient (R) of -0.421 and weighted average of 86.8%. Similarly, the statistical analysis conducted on geographies consisting of 457,082,957 people shows a poor negative correlation between the proportion of Immigrants from China and percentage of population with at least 11th grade education in the United States with a correlation coefficient (R) of -0.179 and weighted average of 92.3%, a difference of 6.3%.
11th Grade Correlation Summary
| Measurement | Immigrants from Latin America | Immigrants from China |
| Minimum | 26.2% | 74.5% |
| Maximum | 96.1% | 100.0% |
| Range | 69.9% | 25.5% |
| Mean | 82.2% | 91.4% |
| Median | 83.9% | 92.7% |
| Interquartile 25% (IQ1) | 77.5% | 89.2% |
| Interquartile 75% (IQ3) | 89.8% | 95.6% |
| Interquartile Range (IQR) | 12.3% | 6.4% |
| Standard Deviation (Sample) | 11.1% | 6.3% |
| Standard Deviation (Population) | 11.1% | 6.3% |
Similar Demographics by 11th Grade
Demographics Similar to Immigrants from Latin America by 11th Grade
In terms of 11th grade, the demographic groups most similar to Immigrants from Latin America are Immigrants from Dominican Republic (86.9%, a difference of 0.12%), Immigrants from Honduras (86.9%, a difference of 0.12%), Central American (86.9%, a difference of 0.17%), Houma (87.0%, a difference of 0.26%), and Immigrants from Yemen (87.1%, a difference of 0.33%).
| Demographics | Rating | Rank | 11th Grade |
| Hispanics or Latinos | 0.0 /100 | #331 | Tragic 87.3% |
| Immigrants | Azores | 0.0 /100 | #332 | Tragic 87.2% |
| Immigrants | Yemen | 0.0 /100 | #333 | Tragic 87.1% |
| Houma | 0.0 /100 | #334 | Tragic 87.0% |
| Central Americans | 0.0 /100 | #335 | Tragic 86.9% |
| Immigrants | Dominican Republic | 0.0 /100 | #336 | Tragic 86.9% |
| Immigrants | Honduras | 0.0 /100 | #337 | Tragic 86.9% |
| Immigrants | Latin America | 0.0 /100 | #338 | Tragic 86.8% |
| Guatemalans | 0.0 /100 | #339 | Tragic 86.4% |
| Salvadorans | 0.0 /100 | #340 | Tragic 86.2% |
| Mexicans | 0.0 /100 | #341 | Tragic 86.1% |
| Immigrants | Guatemala | 0.0 /100 | #342 | Tragic 85.8% |
| Immigrants | El Salvador | 0.0 /100 | #343 | Tragic 85.3% |
| Yakama | 0.0 /100 | #344 | Tragic 85.0% |
| Immigrants | Central America | 0.0 /100 | #345 | Tragic 84.9% |
Demographics Similar to Immigrants from China by 11th Grade
In terms of 11th grade, the demographic groups most similar to Immigrants from China are Immigrants from Uganda (92.3%, a difference of 0.0%), Samoan (92.3%, a difference of 0.0%), Marshallese (92.3%, a difference of 0.010%), Hawaiian (92.3%, a difference of 0.010%), and Immigrants from Eastern Africa (92.3%, a difference of 0.010%).
| Demographics | Rating | Rank | 11th Grade |
| Sioux | 28.5 /100 | #194 | Fair 92.3% |
| Liberians | 26.8 /100 | #195 | Fair 92.3% |
| Panamanians | 26.4 /100 | #196 | Fair 92.3% |
| Marshallese | 26.0 /100 | #197 | Fair 92.3% |
| Hawaiians | 25.5 /100 | #198 | Fair 92.3% |
| Immigrants | Uganda | 25.2 /100 | #199 | Fair 92.3% |
| Samoans | 25.1 /100 | #200 | Fair 92.3% |
| Immigrants | China | 25.1 /100 | #201 | Fair 92.3% |
| Immigrants | Eastern Africa | 24.1 /100 | #202 | Fair 92.3% |
| Immigrants | Sudan | 23.5 /100 | #203 | Fair 92.3% |
| Immigrants | Hong Kong | 23.3 /100 | #204 | Fair 92.2% |
| Kiowa | 23.2 /100 | #205 | Fair 92.2% |
| Bolivians | 23.2 /100 | #206 | Fair 92.2% |
| Immigrants | Oceania | 22.4 /100 | #207 | Fair 92.2% |
| Colville | 21.8 /100 | #208 | Fair 92.2% |