Hmong vs Immigrants from Chile 11th Grade
COMPARE
Hmong
Immigrants from Chile
11th Grade
11th Grade Comparison
Hmong
Immigrants from Chile
92.8%
11TH GRADE
78.6/ 100
METRIC RATING
148th/ 347
METRIC RANK
92.4%
11TH GRADE
33.3/ 100
METRIC RATING
189th/ 347
METRIC RANK
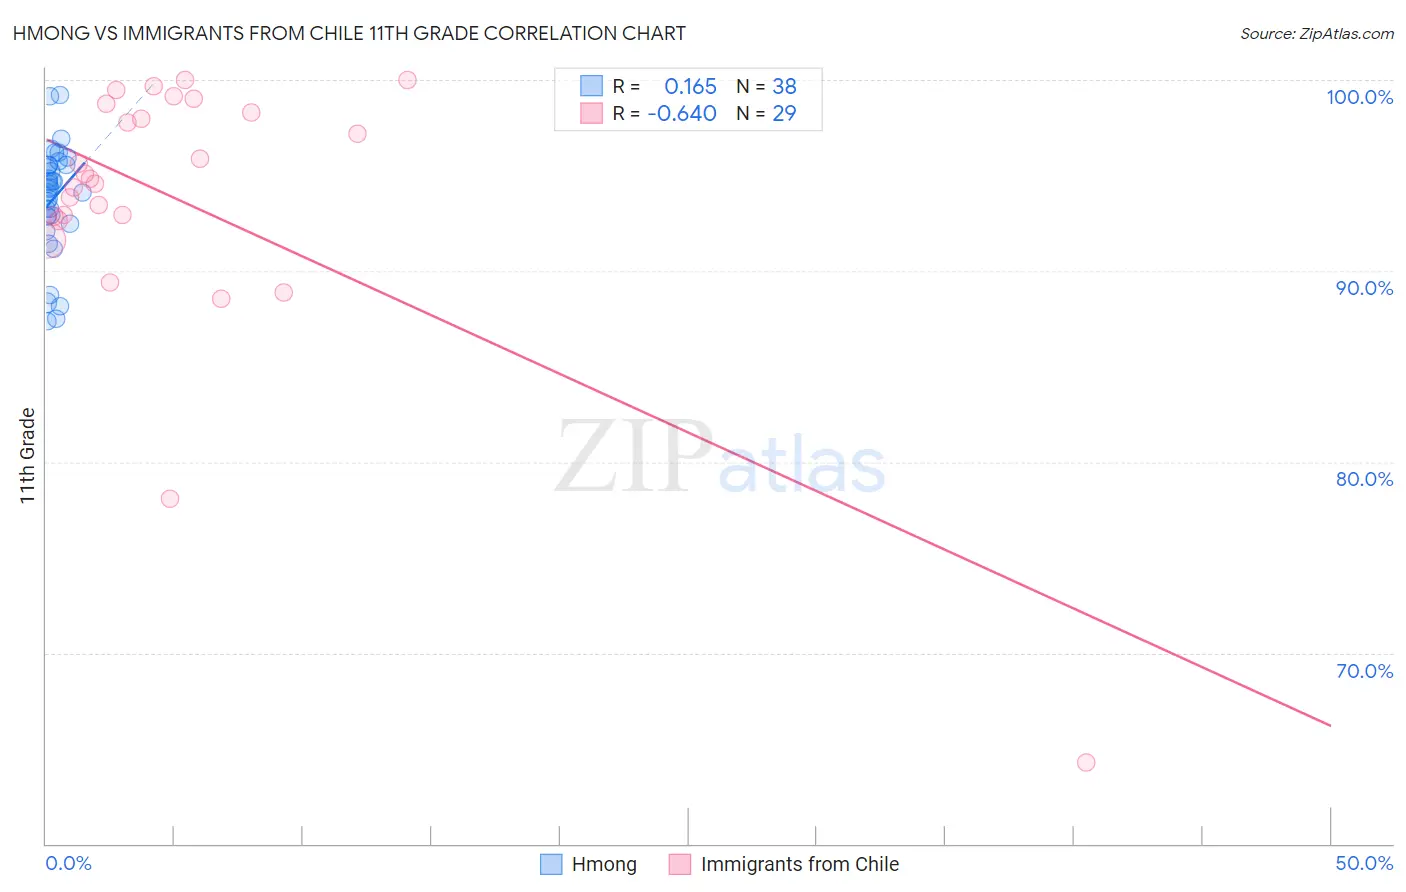
Hmong vs Immigrants from Chile 11th Grade Correlation Chart
The statistical analysis conducted on geographies consisting of 24,672,093 people shows a poor positive correlation between the proportion of Hmong and percentage of population with at least 11th grade education in the United States with a correlation coefficient (R) of 0.165 and weighted average of 92.8%. Similarly, the statistical analysis conducted on geographies consisting of 218,647,266 people shows a significant negative correlation between the proportion of Immigrants from Chile and percentage of population with at least 11th grade education in the United States with a correlation coefficient (R) of -0.640 and weighted average of 92.4%, a difference of 0.49%.
11th Grade Correlation Summary
| Measurement | Hmong | Immigrants from Chile |
| Minimum | 87.4% | 64.3% |
| Maximum | 99.2% | 100.0% |
| Range | 11.9% | 35.7% |
| Mean | 93.8% | 93.7% |
| Median | 94.3% | 94.8% |
| Interquartile 25% (IQ1) | 92.8% | 92.8% |
| Interquartile 75% (IQ3) | 95.5% | 98.5% |
| Interquartile Range (IQR) | 2.7% | 5.8% |
| Standard Deviation (Sample) | 2.9% | 7.3% |
| Standard Deviation (Population) | 2.8% | 7.2% |
Similar Demographics by 11th Grade
Demographics Similar to Hmong by 11th Grade
In terms of 11th grade, the demographic groups most similar to Hmong are Immigrants from Kenya (92.8%, a difference of 0.0%), Immigrants from Poland (92.8%, a difference of 0.0%), Iroquois (92.8%, a difference of 0.010%), Pakistani (92.8%, a difference of 0.020%), and Immigrants from Egypt (92.8%, a difference of 0.020%).
| Demographics | Rating | Rank | 11th Grade |
| Chileans | 83.0 /100 | #141 | Excellent 92.9% |
| Kenyans | 82.0 /100 | #142 | Excellent 92.9% |
| Ugandans | 81.4 /100 | #143 | Excellent 92.9% |
| Assyrians/Chaldeans/Syriacs | 80.5 /100 | #144 | Excellent 92.8% |
| Pakistanis | 79.6 /100 | #145 | Good 92.8% |
| Iroquois | 79.1 /100 | #146 | Good 92.8% |
| Immigrants | Kenya | 78.7 /100 | #147 | Good 92.8% |
| Hmong | 78.6 /100 | #148 | Good 92.8% |
| Immigrants | Poland | 78.5 /100 | #149 | Good 92.8% |
| Immigrants | Egypt | 77.5 /100 | #150 | Good 92.8% |
| Potawatomi | 74.3 /100 | #151 | Good 92.8% |
| Iraqis | 74.2 /100 | #152 | Good 92.8% |
| Brazilians | 73.9 /100 | #153 | Good 92.8% |
| Osage | 73.4 /100 | #154 | Good 92.7% |
| Argentineans | 73.4 /100 | #155 | Good 92.7% |
Demographics Similar to Immigrants from Chile by 11th Grade
In terms of 11th grade, the demographic groups most similar to Immigrants from Chile are Immigrants from Indonesia (92.4%, a difference of 0.0%), Arapaho (92.4%, a difference of 0.020%), Immigrants from Western Asia (92.4%, a difference of 0.020%), Chickasaw (92.3%, a difference of 0.020%), and Immigrants from Nepal (92.4%, a difference of 0.030%).
| Demographics | Rating | Rank | 11th Grade |
| Immigrants | Morocco | 38.6 /100 | #182 | Fair 92.4% |
| Immigrants | Malaysia | 37.6 /100 | #183 | Fair 92.4% |
| Immigrants | Asia | 37.4 /100 | #184 | Fair 92.4% |
| Immigrants | Nepal | 36.4 /100 | #185 | Fair 92.4% |
| Arapaho | 35.1 /100 | #186 | Fair 92.4% |
| Immigrants | Western Asia | 35.0 /100 | #187 | Fair 92.4% |
| Immigrants | Indonesia | 33.7 /100 | #188 | Fair 92.4% |
| Immigrants | Chile | 33.3 /100 | #189 | Fair 92.4% |
| Chickasaw | 31.4 /100 | #190 | Fair 92.3% |
| French American Indians | 30.8 /100 | #191 | Fair 92.3% |
| Immigrants | Syria | 30.4 /100 | #192 | Fair 92.3% |
| Moroccans | 28.7 /100 | #193 | Fair 92.3% |
| Sioux | 28.5 /100 | #194 | Fair 92.3% |
| Liberians | 26.8 /100 | #195 | Fair 92.3% |
| Panamanians | 26.4 /100 | #196 | Fair 92.3% |