Hispanic or Latino vs Lebanese Bachelor's Degree
COMPARE
Hispanic or Latino
Lebanese
Bachelor's Degree
Bachelor's Degree Comparison
Hispanics or Latinos
Lebanese
29.6%
BACHELOR'S DEGREE
0.0/ 100
METRIC RATING
309th/ 347
METRIC RANK
40.4%
BACHELOR'S DEGREE
94.3/ 100
METRIC RATING
123rd/ 347
METRIC RANK
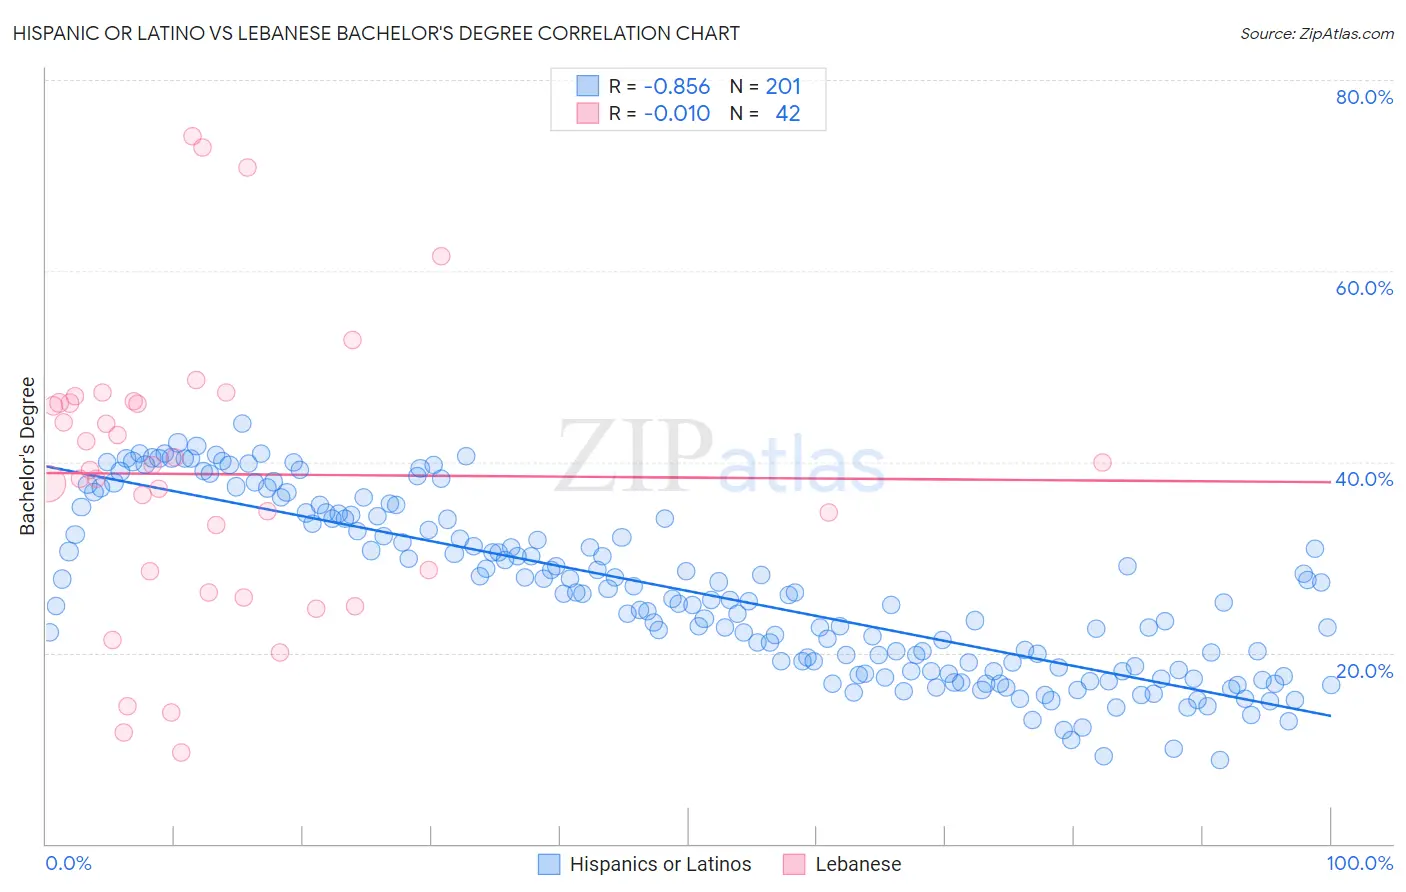
Hispanic or Latino vs Lebanese Bachelor's Degree Correlation Chart
The statistical analysis conducted on geographies consisting of 578,331,176 people shows a very strong negative correlation between the proportion of Hispanics or Latinos and percentage of population with at least bachelor's degree education in the United States with a correlation coefficient (R) of -0.856 and weighted average of 29.6%. Similarly, the statistical analysis conducted on geographies consisting of 401,587,457 people shows no correlation between the proportion of Lebanese and percentage of population with at least bachelor's degree education in the United States with a correlation coefficient (R) of -0.010 and weighted average of 40.4%, a difference of 36.6%.
Bachelor's Degree Correlation Summary
| Measurement | Hispanic or Latino | Lebanese |
| Minimum | 8.7% | 9.6% |
| Maximum | 44.0% | 74.0% |
| Range | 35.3% | 64.5% |
| Mean | 26.4% | 38.7% |
| Median | 25.6% | 39.4% |
| Interquartile 25% (IQ1) | 18.1% | 28.6% |
| Interquartile 75% (IQ3) | 34.1% | 46.2% |
| Interquartile Range (IQR) | 16.0% | 17.6% |
| Standard Deviation (Sample) | 8.9% | 15.0% |
| Standard Deviation (Population) | 8.9% | 14.9% |
Similar Demographics by Bachelor's Degree
Demographics Similar to Hispanics or Latinos by Bachelor's Degree
In terms of bachelor's degree, the demographic groups most similar to Hispanics or Latinos are Cajun (29.6%, a difference of 0.18%), Cheyenne (29.4%, a difference of 0.47%), Choctaw (29.4%, a difference of 0.54%), Seminole (29.4%, a difference of 0.60%), and Alaska Native (29.4%, a difference of 0.78%).
| Demographics | Rating | Rank | Bachelor's Degree |
| Mexican American Indians | 0.0 /100 | #302 | Tragic 30.2% |
| Bangladeshis | 0.0 /100 | #303 | Tragic 30.2% |
| Cherokee | 0.0 /100 | #304 | Tragic 30.2% |
| Immigrants | Latin America | 0.0 /100 | #305 | Tragic 30.1% |
| Immigrants | Yemen | 0.0 /100 | #306 | Tragic 29.9% |
| Nepalese | 0.0 /100 | #307 | Tragic 29.9% |
| Cajuns | 0.0 /100 | #308 | Tragic 29.6% |
| Hispanics or Latinos | 0.0 /100 | #309 | Tragic 29.6% |
| Cheyenne | 0.0 /100 | #310 | Tragic 29.4% |
| Choctaw | 0.0 /100 | #311 | Tragic 29.4% |
| Seminole | 0.0 /100 | #312 | Tragic 29.4% |
| Alaska Natives | 0.0 /100 | #313 | Tragic 29.4% |
| Shoshone | 0.0 /100 | #314 | Tragic 29.3% |
| Immigrants | Cabo Verde | 0.0 /100 | #315 | Tragic 29.2% |
| Sioux | 0.0 /100 | #316 | Tragic 29.1% |
Demographics Similar to Lebanese by Bachelor's Degree
In terms of bachelor's degree, the demographic groups most similar to Lebanese are Immigrants from Eritrea (40.4%, a difference of 0.0%), Immigrants from Albania (40.4%, a difference of 0.020%), British (40.4%, a difference of 0.040%), Immigrants from Eastern Africa (40.4%, a difference of 0.090%), and Moroccan (40.5%, a difference of 0.12%).
| Demographics | Rating | Rank | Bachelor's Degree |
| Immigrants | Uganda | 95.7 /100 | #116 | Exceptional 40.7% |
| Austrians | 95.5 /100 | #117 | Exceptional 40.6% |
| Croatians | 95.5 /100 | #118 | Exceptional 40.6% |
| Immigrants | Syria | 94.9 /100 | #119 | Exceptional 40.5% |
| Venezuelans | 94.7 /100 | #120 | Exceptional 40.5% |
| Moroccans | 94.6 /100 | #121 | Exceptional 40.5% |
| Immigrants | Albania | 94.4 /100 | #122 | Exceptional 40.4% |
| Lebanese | 94.3 /100 | #123 | Exceptional 40.4% |
| Immigrants | Eritrea | 94.3 /100 | #124 | Exceptional 40.4% |
| British | 94.2 /100 | #125 | Exceptional 40.4% |
| Immigrants | Eastern Africa | 94.1 /100 | #126 | Exceptional 40.4% |
| Immigrants | Jordan | 93.4 /100 | #127 | Exceptional 40.3% |
| Immigrants | Venezuela | 92.9 /100 | #128 | Exceptional 40.2% |
| Serbians | 92.4 /100 | #129 | Exceptional 40.1% |
| Sierra Leoneans | 92.2 /100 | #130 | Exceptional 40.1% |