Cuban vs Lebanese Bachelor's Degree
COMPARE
Cuban
Lebanese
Bachelor's Degree
Bachelor's Degree Comparison
Cubans
Lebanese
32.5%
BACHELOR'S DEGREE
0.3/ 100
METRIC RATING
267th/ 347
METRIC RANK
40.4%
BACHELOR'S DEGREE
94.3/ 100
METRIC RATING
123rd/ 347
METRIC RANK
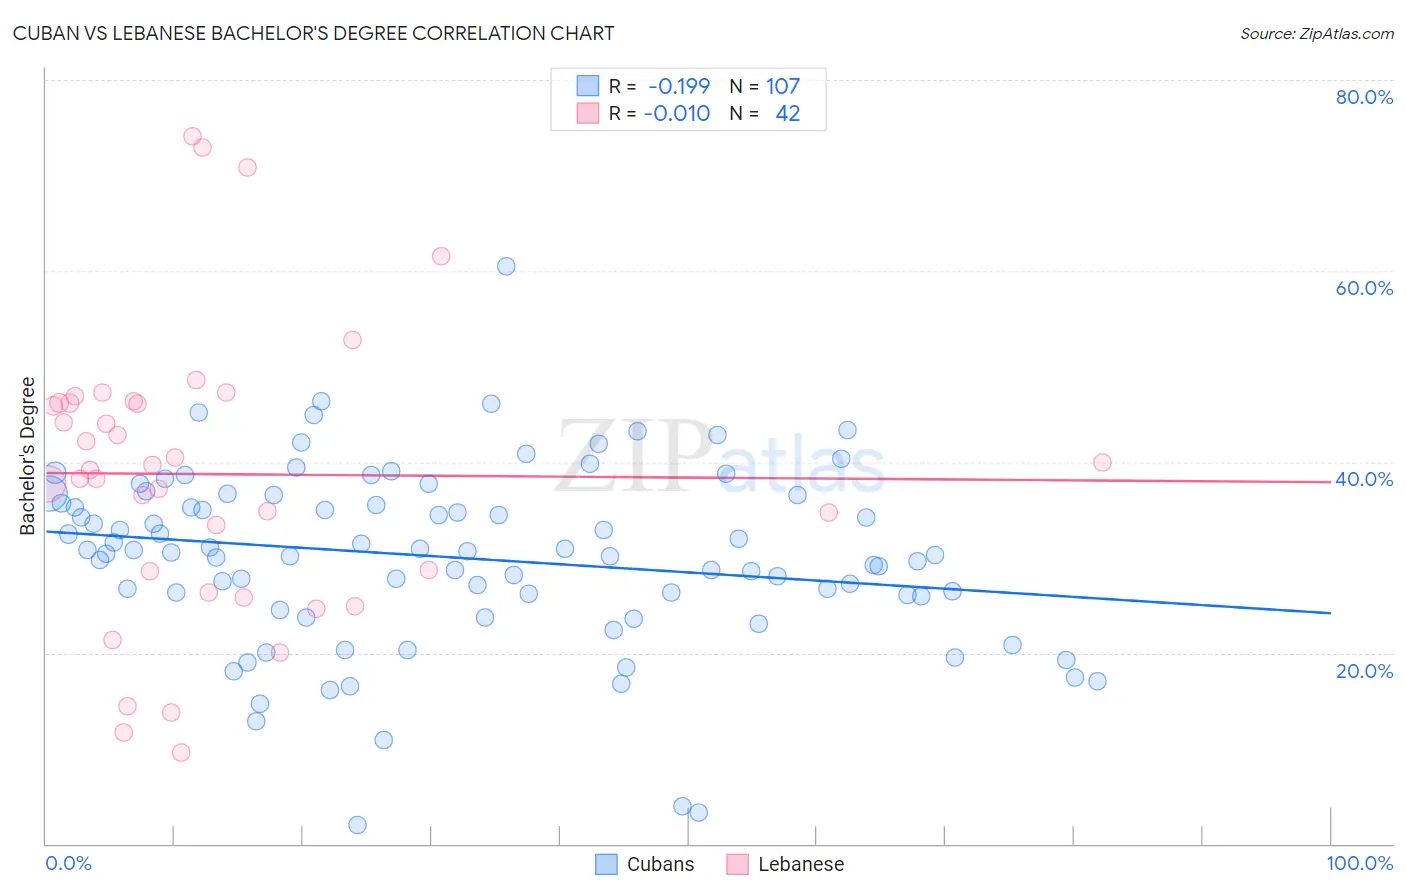
Cuban vs Lebanese Bachelor's Degree Correlation Chart
The statistical analysis conducted on geographies consisting of 449,220,145 people shows a poor negative correlation between the proportion of Cubans and percentage of population with at least bachelor's degree education in the United States with a correlation coefficient (R) of -0.199 and weighted average of 32.5%. Similarly, the statistical analysis conducted on geographies consisting of 401,587,457 people shows no correlation between the proportion of Lebanese and percentage of population with at least bachelor's degree education in the United States with a correlation coefficient (R) of -0.010 and weighted average of 40.4%, a difference of 24.4%.
Bachelor's Degree Correlation Summary
| Measurement | Cuban | Lebanese |
| Minimum | 2.0% | 9.6% |
| Maximum | 60.5% | 74.0% |
| Range | 58.5% | 64.5% |
| Mean | 30.0% | 38.7% |
| Median | 30.6% | 39.4% |
| Interquartile 25% (IQ1) | 25.9% | 28.6% |
| Interquartile 75% (IQ3) | 36.5% | 46.2% |
| Interquartile Range (IQR) | 10.6% | 17.6% |
| Standard Deviation (Sample) | 9.5% | 15.0% |
| Standard Deviation (Population) | 9.5% | 14.9% |
Similar Demographics by Bachelor's Degree
Demographics Similar to Cubans by Bachelor's Degree
In terms of bachelor's degree, the demographic groups most similar to Cubans are Immigrants from Dominica (32.5%, a difference of 0.12%), Bahamian (32.5%, a difference of 0.15%), Central American Indian (32.5%, a difference of 0.18%), Immigrants from Portugal (32.2%, a difference of 0.76%), and Belizean (32.8%, a difference of 0.96%).
| Demographics | Rating | Rank | Bachelor's Degree |
| Malaysians | 0.5 /100 | #260 | Tragic 32.9% |
| Africans | 0.5 /100 | #261 | Tragic 32.9% |
| Immigrants | Jamaica | 0.5 /100 | #262 | Tragic 32.9% |
| Belizeans | 0.4 /100 | #263 | Tragic 32.8% |
| Central American Indians | 0.3 /100 | #264 | Tragic 32.5% |
| Bahamians | 0.3 /100 | #265 | Tragic 32.5% |
| Immigrants | Dominica | 0.3 /100 | #266 | Tragic 32.5% |
| Cubans | 0.3 /100 | #267 | Tragic 32.5% |
| Immigrants | Portugal | 0.2 /100 | #268 | Tragic 32.2% |
| Immigrants | Belize | 0.2 /100 | #269 | Tragic 32.1% |
| Immigrants | Nicaragua | 0.2 /100 | #270 | Tragic 31.9% |
| Central Americans | 0.2 /100 | #271 | Tragic 31.9% |
| Comanche | 0.2 /100 | #272 | Tragic 31.9% |
| Americans | 0.2 /100 | #273 | Tragic 31.9% |
| Potawatomi | 0.2 /100 | #274 | Tragic 31.9% |
Demographics Similar to Lebanese by Bachelor's Degree
In terms of bachelor's degree, the demographic groups most similar to Lebanese are Immigrants from Eritrea (40.4%, a difference of 0.0%), Immigrants from Albania (40.4%, a difference of 0.020%), British (40.4%, a difference of 0.040%), Immigrants from Eastern Africa (40.4%, a difference of 0.090%), and Moroccan (40.5%, a difference of 0.12%).
| Demographics | Rating | Rank | Bachelor's Degree |
| Immigrants | Uganda | 95.7 /100 | #116 | Exceptional 40.7% |
| Austrians | 95.5 /100 | #117 | Exceptional 40.6% |
| Croatians | 95.5 /100 | #118 | Exceptional 40.6% |
| Immigrants | Syria | 94.9 /100 | #119 | Exceptional 40.5% |
| Venezuelans | 94.7 /100 | #120 | Exceptional 40.5% |
| Moroccans | 94.6 /100 | #121 | Exceptional 40.5% |
| Immigrants | Albania | 94.4 /100 | #122 | Exceptional 40.4% |
| Lebanese | 94.3 /100 | #123 | Exceptional 40.4% |
| Immigrants | Eritrea | 94.3 /100 | #124 | Exceptional 40.4% |
| British | 94.2 /100 | #125 | Exceptional 40.4% |
| Immigrants | Eastern Africa | 94.1 /100 | #126 | Exceptional 40.4% |
| Immigrants | Jordan | 93.4 /100 | #127 | Exceptional 40.3% |
| Immigrants | Venezuela | 92.9 /100 | #128 | Exceptional 40.2% |
| Serbians | 92.4 /100 | #129 | Exceptional 40.1% |
| Sierra Leoneans | 92.2 /100 | #130 | Exceptional 40.1% |