Hispanic or Latino vs Indian (Asian) Bachelor's Degree
COMPARE
Hispanic or Latino
Indian (Asian)
Bachelor's Degree
Bachelor's Degree Comparison
Hispanics or Latinos
Indians (Asian)
29.6%
BACHELOR'S DEGREE
0.0/ 100
METRIC RATING
309th/ 347
METRIC RANK
47.4%
BACHELOR'S DEGREE
100.0/ 100
METRIC RATING
18th/ 347
METRIC RANK
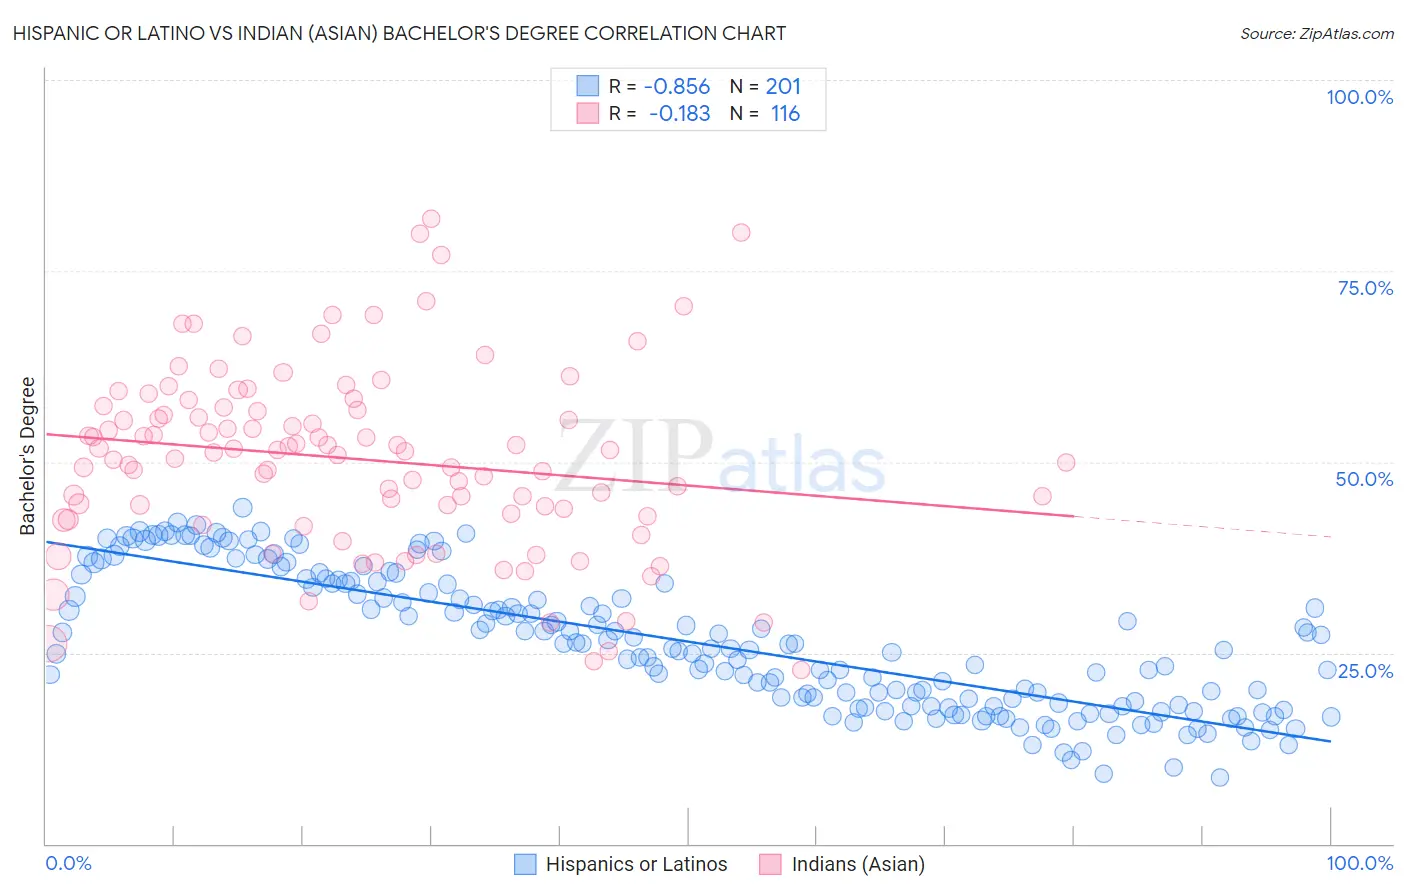
Hispanic or Latino vs Indian (Asian) Bachelor's Degree Correlation Chart
The statistical analysis conducted on geographies consisting of 578,331,176 people shows a very strong negative correlation between the proportion of Hispanics or Latinos and percentage of population with at least bachelor's degree education in the United States with a correlation coefficient (R) of -0.856 and weighted average of 29.6%. Similarly, the statistical analysis conducted on geographies consisting of 495,247,229 people shows a poor negative correlation between the proportion of Indians (Asian) and percentage of population with at least bachelor's degree education in the United States with a correlation coefficient (R) of -0.183 and weighted average of 47.4%, a difference of 60.4%.
Bachelor's Degree Correlation Summary
| Measurement | Hispanic or Latino | Indian (Asian) |
| Minimum | 8.7% | 22.8% |
| Maximum | 44.0% | 81.8% |
| Range | 35.3% | 59.0% |
| Mean | 26.4% | 50.4% |
| Median | 25.6% | 51.3% |
| Interquartile 25% (IQ1) | 18.1% | 43.1% |
| Interquartile 75% (IQ3) | 34.1% | 56.9% |
| Interquartile Range (IQR) | 16.0% | 13.9% |
| Standard Deviation (Sample) | 8.9% | 11.9% |
| Standard Deviation (Population) | 8.9% | 11.9% |
Similar Demographics by Bachelor's Degree
Demographics Similar to Hispanics or Latinos by Bachelor's Degree
In terms of bachelor's degree, the demographic groups most similar to Hispanics or Latinos are Cajun (29.6%, a difference of 0.18%), Cheyenne (29.4%, a difference of 0.47%), Choctaw (29.4%, a difference of 0.54%), Seminole (29.4%, a difference of 0.60%), and Alaska Native (29.4%, a difference of 0.78%).
| Demographics | Rating | Rank | Bachelor's Degree |
| Mexican American Indians | 0.0 /100 | #302 | Tragic 30.2% |
| Bangladeshis | 0.0 /100 | #303 | Tragic 30.2% |
| Cherokee | 0.0 /100 | #304 | Tragic 30.2% |
| Immigrants | Latin America | 0.0 /100 | #305 | Tragic 30.1% |
| Immigrants | Yemen | 0.0 /100 | #306 | Tragic 29.9% |
| Nepalese | 0.0 /100 | #307 | Tragic 29.9% |
| Cajuns | 0.0 /100 | #308 | Tragic 29.6% |
| Hispanics or Latinos | 0.0 /100 | #309 | Tragic 29.6% |
| Cheyenne | 0.0 /100 | #310 | Tragic 29.4% |
| Choctaw | 0.0 /100 | #311 | Tragic 29.4% |
| Seminole | 0.0 /100 | #312 | Tragic 29.4% |
| Alaska Natives | 0.0 /100 | #313 | Tragic 29.4% |
| Shoshone | 0.0 /100 | #314 | Tragic 29.3% |
| Immigrants | Cabo Verde | 0.0 /100 | #315 | Tragic 29.2% |
| Sioux | 0.0 /100 | #316 | Tragic 29.1% |
Demographics Similar to Indians (Asian) by Bachelor's Degree
In terms of bachelor's degree, the demographic groups most similar to Indians (Asian) are Eastern European (47.5%, a difference of 0.15%), Cambodian (47.2%, a difference of 0.43%), Immigrants from Switzerland (47.1%, a difference of 0.65%), Immigrants from Ireland (47.1%, a difference of 0.66%), and Immigrants from Belgium (47.0%, a difference of 0.86%).
| Demographics | Rating | Rank | Bachelor's Degree |
| Immigrants | Australia | 100.0 /100 | #11 | Exceptional 48.5% |
| Immigrants | China | 100.0 /100 | #12 | Exceptional 48.4% |
| Immigrants | South Central Asia | 100.0 /100 | #13 | Exceptional 48.3% |
| Immigrants | Hong Kong | 100.0 /100 | #14 | Exceptional 48.2% |
| Immigrants | Eastern Asia | 100.0 /100 | #15 | Exceptional 48.1% |
| Soviet Union | 100.0 /100 | #16 | Exceptional 47.9% |
| Eastern Europeans | 100.0 /100 | #17 | Exceptional 47.5% |
| Indians (Asian) | 100.0 /100 | #18 | Exceptional 47.4% |
| Cambodians | 100.0 /100 | #19 | Exceptional 47.2% |
| Immigrants | Switzerland | 100.0 /100 | #20 | Exceptional 47.1% |
| Immigrants | Ireland | 100.0 /100 | #21 | Exceptional 47.1% |
| Immigrants | Belgium | 100.0 /100 | #22 | Exceptional 47.0% |
| Immigrants | Sweden | 100.0 /100 | #23 | Exceptional 47.0% |
| Immigrants | Korea | 100.0 /100 | #24 | Exceptional 47.0% |
| Burmese | 100.0 /100 | #25 | Exceptional 46.9% |