Hispanic or Latino vs Yuman Bachelor's Degree
COMPARE
Hispanic or Latino
Yuman
Bachelor's Degree
Bachelor's Degree Comparison
Hispanics or Latinos
Yuman
29.6%
BACHELOR'S DEGREE
0.0/ 100
METRIC RATING
309th/ 347
METRIC RANK
24.5%
BACHELOR'S DEGREE
0.0/ 100
METRIC RATING
341st/ 347
METRIC RANK
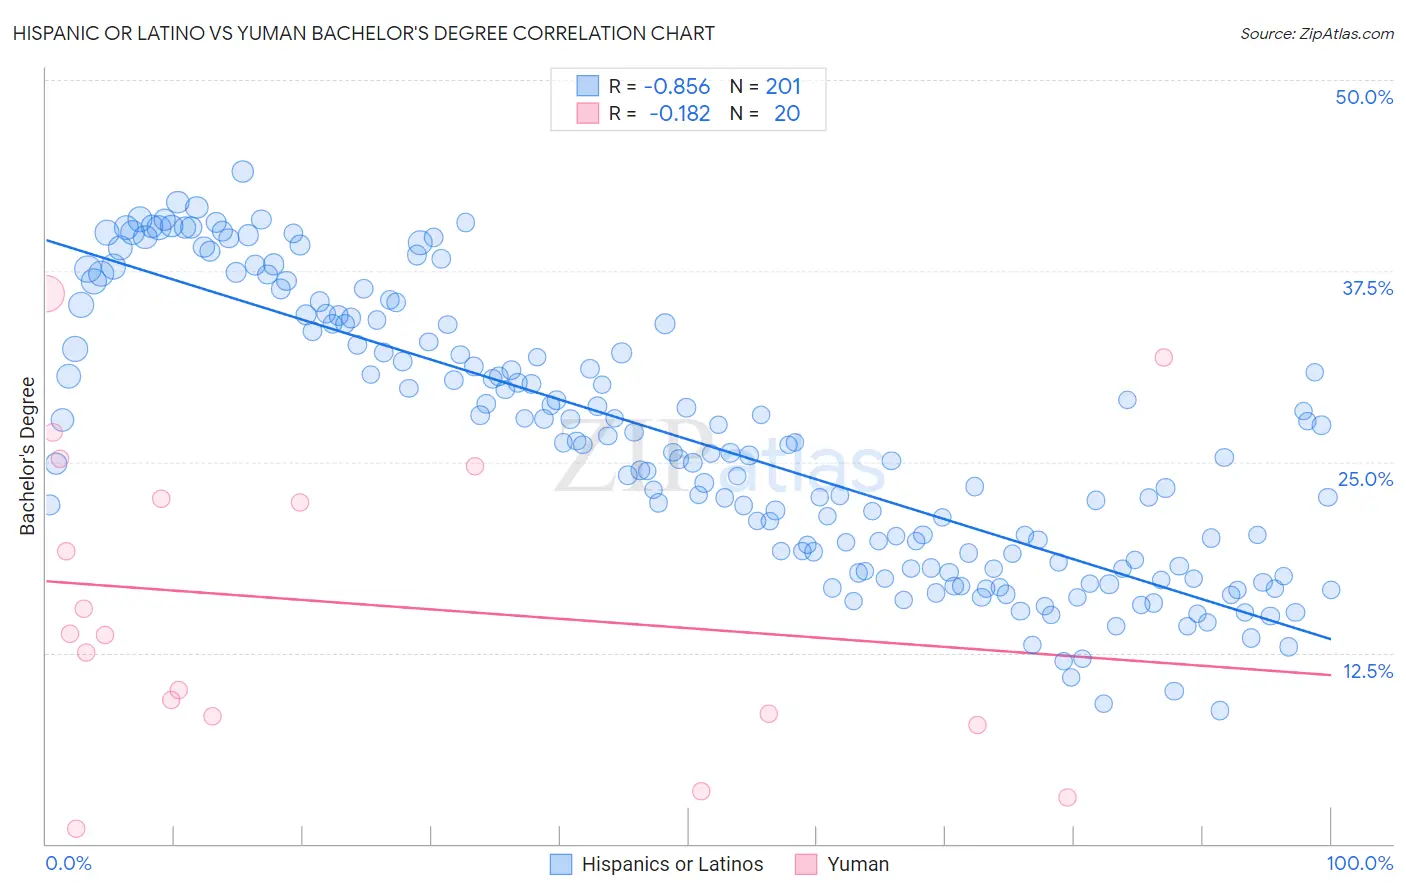
Hispanic or Latino vs Yuman Bachelor's Degree Correlation Chart
The statistical analysis conducted on geographies consisting of 578,331,176 people shows a very strong negative correlation between the proportion of Hispanics or Latinos and percentage of population with at least bachelor's degree education in the United States with a correlation coefficient (R) of -0.856 and weighted average of 29.6%. Similarly, the statistical analysis conducted on geographies consisting of 40,695,853 people shows a poor negative correlation between the proportion of Yuman and percentage of population with at least bachelor's degree education in the United States with a correlation coefficient (R) of -0.182 and weighted average of 24.5%, a difference of 20.6%.
Bachelor's Degree Correlation Summary
| Measurement | Hispanic or Latino | Yuman |
| Minimum | 8.7% | 0.96% |
| Maximum | 44.0% | 36.0% |
| Range | 35.3% | 35.0% |
| Mean | 26.4% | 15.8% |
| Median | 25.6% | 13.7% |
| Interquartile 25% (IQ1) | 18.1% | 8.4% |
| Interquartile 75% (IQ3) | 34.1% | 23.6% |
| Interquartile Range (IQR) | 16.0% | 15.2% |
| Standard Deviation (Sample) | 8.9% | 9.9% |
| Standard Deviation (Population) | 8.9% | 9.6% |
Similar Demographics by Bachelor's Degree
Demographics Similar to Hispanics or Latinos by Bachelor's Degree
In terms of bachelor's degree, the demographic groups most similar to Hispanics or Latinos are Cajun (29.6%, a difference of 0.18%), Cheyenne (29.4%, a difference of 0.47%), Choctaw (29.4%, a difference of 0.54%), Seminole (29.4%, a difference of 0.60%), and Alaska Native (29.4%, a difference of 0.78%).
| Demographics | Rating | Rank | Bachelor's Degree |
| Mexican American Indians | 0.0 /100 | #302 | Tragic 30.2% |
| Bangladeshis | 0.0 /100 | #303 | Tragic 30.2% |
| Cherokee | 0.0 /100 | #304 | Tragic 30.2% |
| Immigrants | Latin America | 0.0 /100 | #305 | Tragic 30.1% |
| Immigrants | Yemen | 0.0 /100 | #306 | Tragic 29.9% |
| Nepalese | 0.0 /100 | #307 | Tragic 29.9% |
| Cajuns | 0.0 /100 | #308 | Tragic 29.6% |
| Hispanics or Latinos | 0.0 /100 | #309 | Tragic 29.6% |
| Cheyenne | 0.0 /100 | #310 | Tragic 29.4% |
| Choctaw | 0.0 /100 | #311 | Tragic 29.4% |
| Seminole | 0.0 /100 | #312 | Tragic 29.4% |
| Alaska Natives | 0.0 /100 | #313 | Tragic 29.4% |
| Shoshone | 0.0 /100 | #314 | Tragic 29.3% |
| Immigrants | Cabo Verde | 0.0 /100 | #315 | Tragic 29.2% |
| Sioux | 0.0 /100 | #316 | Tragic 29.1% |
Demographics Similar to Yuman by Bachelor's Degree
In terms of bachelor's degree, the demographic groups most similar to Yuman are Yakama (24.5%, a difference of 0.27%), Tohono O'odham (24.4%, a difference of 0.47%), Lumbee (24.8%, a difference of 0.92%), Hopi (25.3%, a difference of 3.1%), and Navajo (23.6%, a difference of 3.9%).
| Demographics | Rating | Rank | Bachelor's Degree |
| Mexicans | 0.0 /100 | #333 | Tragic 27.1% |
| Arapaho | 0.0 /100 | #334 | Tragic 26.6% |
| Natives/Alaskans | 0.0 /100 | #335 | Tragic 26.3% |
| Immigrants | Mexico | 0.0 /100 | #336 | Tragic 26.1% |
| Inupiat | 0.0 /100 | #337 | Tragic 25.8% |
| Pueblo | 0.0 /100 | #338 | Tragic 25.5% |
| Hopi | 0.0 /100 | #339 | Tragic 25.3% |
| Lumbee | 0.0 /100 | #340 | Tragic 24.8% |
| Yuman | 0.0 /100 | #341 | Tragic 24.5% |
| Yakama | 0.0 /100 | #342 | Tragic 24.5% |
| Tohono O'odham | 0.0 /100 | #343 | Tragic 24.4% |
| Navajo | 0.0 /100 | #344 | Tragic 23.6% |
| Pima | 0.0 /100 | #345 | Tragic 23.2% |
| Houma | 0.0 /100 | #346 | Tragic 21.4% |
| Yup'ik | 0.0 /100 | #347 | Tragic 19.4% |