Hispanic or Latino vs Barbadian Bachelor's Degree
COMPARE
Hispanic or Latino
Barbadian
Bachelor's Degree
Bachelor's Degree Comparison
Hispanics or Latinos
Barbadians
29.6%
BACHELOR'S DEGREE
0.0/ 100
METRIC RATING
309th/ 347
METRIC RANK
36.1%
BACHELOR'S DEGREE
13.5/ 100
METRIC RATING
216th/ 347
METRIC RANK
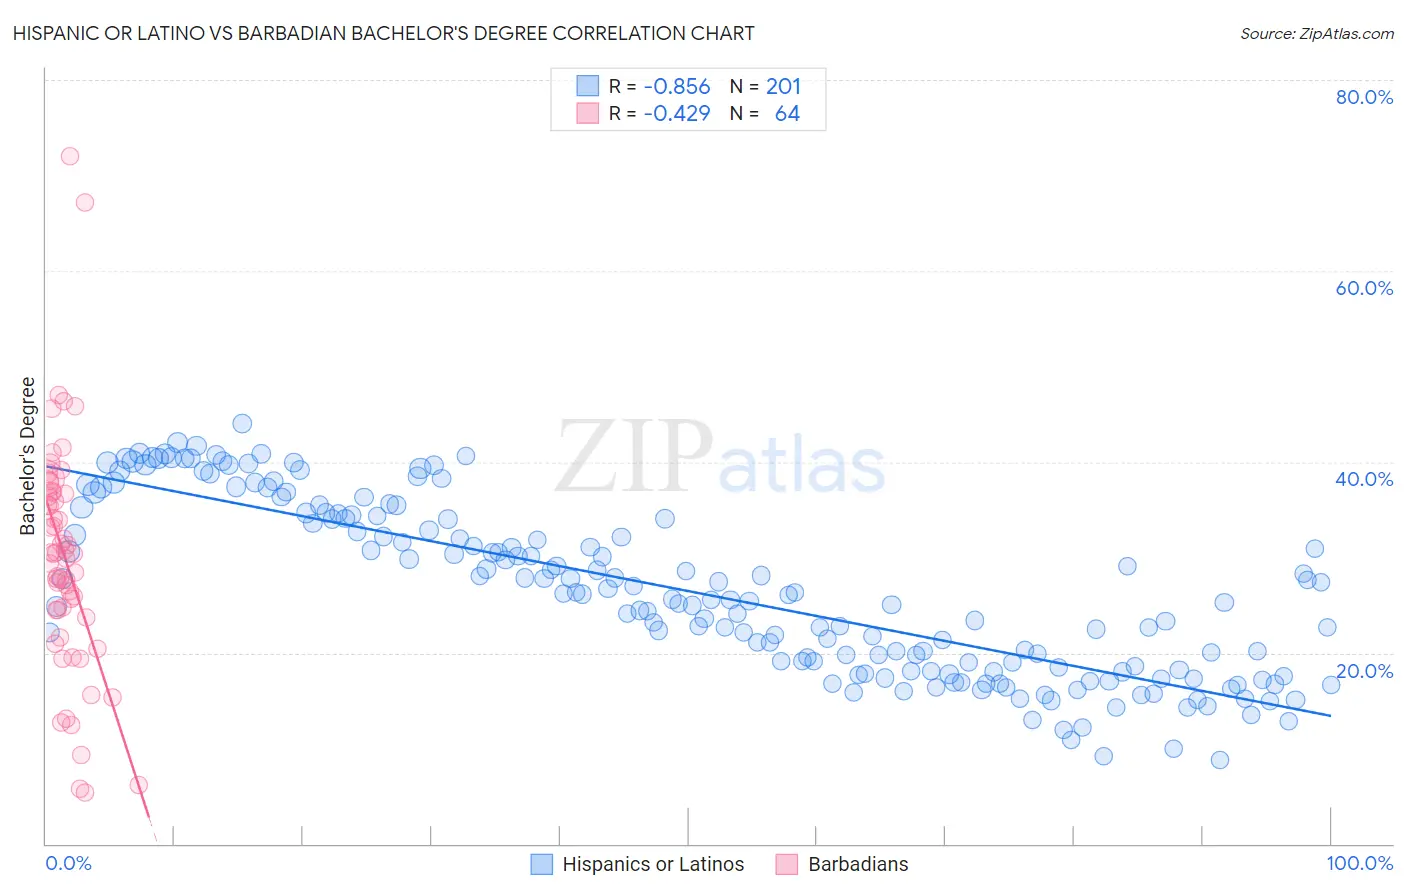
Hispanic or Latino vs Barbadian Bachelor's Degree Correlation Chart
The statistical analysis conducted on geographies consisting of 578,331,176 people shows a very strong negative correlation between the proportion of Hispanics or Latinos and percentage of population with at least bachelor's degree education in the United States with a correlation coefficient (R) of -0.856 and weighted average of 29.6%. Similarly, the statistical analysis conducted on geographies consisting of 141,300,746 people shows a moderate negative correlation between the proportion of Barbadians and percentage of population with at least bachelor's degree education in the United States with a correlation coefficient (R) of -0.429 and weighted average of 36.1%, a difference of 22.1%.
Bachelor's Degree Correlation Summary
| Measurement | Hispanic or Latino | Barbadian |
| Minimum | 8.7% | 5.4% |
| Maximum | 44.0% | 72.0% |
| Range | 35.3% | 66.6% |
| Mean | 26.4% | 30.0% |
| Median | 25.6% | 30.3% |
| Interquartile 25% (IQ1) | 18.1% | 24.1% |
| Interquartile 75% (IQ3) | 34.1% | 36.8% |
| Interquartile Range (IQR) | 16.0% | 12.7% |
| Standard Deviation (Sample) | 8.9% | 12.3% |
| Standard Deviation (Population) | 8.9% | 12.2% |
Similar Demographics by Bachelor's Degree
Demographics Similar to Hispanics or Latinos by Bachelor's Degree
In terms of bachelor's degree, the demographic groups most similar to Hispanics or Latinos are Cajun (29.6%, a difference of 0.18%), Cheyenne (29.4%, a difference of 0.47%), Choctaw (29.4%, a difference of 0.54%), Seminole (29.4%, a difference of 0.60%), and Alaska Native (29.4%, a difference of 0.78%).
| Demographics | Rating | Rank | Bachelor's Degree |
| Mexican American Indians | 0.0 /100 | #302 | Tragic 30.2% |
| Bangladeshis | 0.0 /100 | #303 | Tragic 30.2% |
| Cherokee | 0.0 /100 | #304 | Tragic 30.2% |
| Immigrants | Latin America | 0.0 /100 | #305 | Tragic 30.1% |
| Immigrants | Yemen | 0.0 /100 | #306 | Tragic 29.9% |
| Nepalese | 0.0 /100 | #307 | Tragic 29.9% |
| Cajuns | 0.0 /100 | #308 | Tragic 29.6% |
| Hispanics or Latinos | 0.0 /100 | #309 | Tragic 29.6% |
| Cheyenne | 0.0 /100 | #310 | Tragic 29.4% |
| Choctaw | 0.0 /100 | #311 | Tragic 29.4% |
| Seminole | 0.0 /100 | #312 | Tragic 29.4% |
| Alaska Natives | 0.0 /100 | #313 | Tragic 29.4% |
| Shoshone | 0.0 /100 | #314 | Tragic 29.3% |
| Immigrants | Cabo Verde | 0.0 /100 | #315 | Tragic 29.2% |
| Sioux | 0.0 /100 | #316 | Tragic 29.1% |
Demographics Similar to Barbadians by Bachelor's Degree
In terms of bachelor's degree, the demographic groups most similar to Barbadians are Immigrants from Western Africa (36.1%, a difference of 0.060%), German (36.1%, a difference of 0.090%), Immigrants from Panama (36.2%, a difference of 0.16%), German Russian (35.8%, a difference of 0.81%), and Immigrants from Philippines (36.4%, a difference of 0.84%).
| Demographics | Rating | Rank | Bachelor's Degree |
| Panamanians | 18.8 /100 | #209 | Poor 36.5% |
| French | 18.6 /100 | #210 | Poor 36.5% |
| Scotch-Irish | 18.3 /100 | #211 | Poor 36.4% |
| Immigrants | Philippines | 17.8 /100 | #212 | Poor 36.4% |
| Immigrants | Panama | 14.2 /100 | #213 | Poor 36.2% |
| Germans | 13.9 /100 | #214 | Poor 36.1% |
| Immigrants | Western Africa | 13.8 /100 | #215 | Poor 36.1% |
| Barbadians | 13.5 /100 | #216 | Poor 36.1% |
| German Russians | 10.2 /100 | #217 | Poor 35.8% |
| Sub-Saharan Africans | 9.8 /100 | #218 | Tragic 35.8% |
| West Indians | 9.7 /100 | #219 | Tragic 35.8% |
| Spanish | 9.6 /100 | #220 | Tragic 35.8% |
| Dutch | 9.2 /100 | #221 | Tragic 35.7% |
| Trinidadians and Tobagonians | 8.8 /100 | #222 | Tragic 35.7% |
| French Canadians | 8.3 /100 | #223 | Tragic 35.6% |