Hispanic or Latino vs Guamanian/Chamorro Bachelor's Degree
COMPARE
Hispanic or Latino
Guamanian/Chamorro
Bachelor's Degree
Bachelor's Degree Comparison
Hispanics or Latinos
Guamanians/Chamorros
29.6%
BACHELOR'S DEGREE
0.0/ 100
METRIC RATING
309th/ 347
METRIC RANK
34.6%
BACHELOR'S DEGREE
3.0/ 100
METRIC RATING
234th/ 347
METRIC RANK
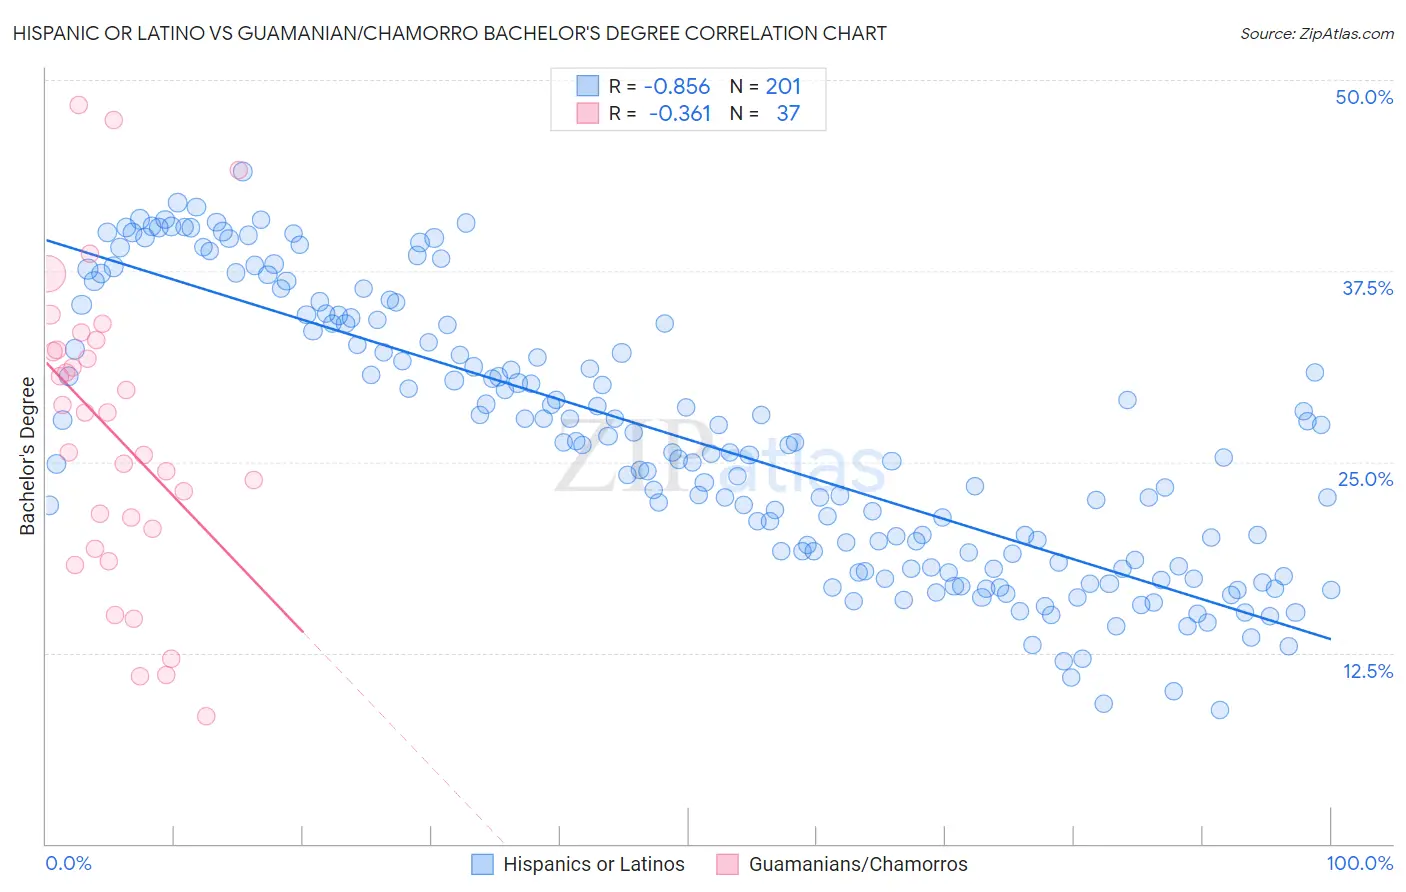
Hispanic or Latino vs Guamanian/Chamorro Bachelor's Degree Correlation Chart
The statistical analysis conducted on geographies consisting of 578,331,176 people shows a very strong negative correlation between the proportion of Hispanics or Latinos and percentage of population with at least bachelor's degree education in the United States with a correlation coefficient (R) of -0.856 and weighted average of 29.6%. Similarly, the statistical analysis conducted on geographies consisting of 221,963,631 people shows a mild negative correlation between the proportion of Guamanians/Chamorros and percentage of population with at least bachelor's degree education in the United States with a correlation coefficient (R) of -0.361 and weighted average of 34.6%, a difference of 17.1%.
Bachelor's Degree Correlation Summary
| Measurement | Hispanic or Latino | Guamanian/Chamorro |
| Minimum | 8.7% | 8.3% |
| Maximum | 44.0% | 48.4% |
| Range | 35.3% | 40.0% |
| Mean | 26.4% | 26.9% |
| Median | 25.6% | 28.2% |
| Interquartile 25% (IQ1) | 18.1% | 20.0% |
| Interquartile 75% (IQ3) | 34.1% | 32.6% |
| Interquartile Range (IQR) | 16.0% | 12.7% |
| Standard Deviation (Sample) | 8.9% | 9.8% |
| Standard Deviation (Population) | 8.9% | 9.7% |
Similar Demographics by Bachelor's Degree
Demographics Similar to Hispanics or Latinos by Bachelor's Degree
In terms of bachelor's degree, the demographic groups most similar to Hispanics or Latinos are Cajun (29.6%, a difference of 0.18%), Cheyenne (29.4%, a difference of 0.47%), Choctaw (29.4%, a difference of 0.54%), Seminole (29.4%, a difference of 0.60%), and Alaska Native (29.4%, a difference of 0.78%).
| Demographics | Rating | Rank | Bachelor's Degree |
| Mexican American Indians | 0.0 /100 | #302 | Tragic 30.2% |
| Bangladeshis | 0.0 /100 | #303 | Tragic 30.2% |
| Cherokee | 0.0 /100 | #304 | Tragic 30.2% |
| Immigrants | Latin America | 0.0 /100 | #305 | Tragic 30.1% |
| Immigrants | Yemen | 0.0 /100 | #306 | Tragic 29.9% |
| Nepalese | 0.0 /100 | #307 | Tragic 29.9% |
| Cajuns | 0.0 /100 | #308 | Tragic 29.6% |
| Hispanics or Latinos | 0.0 /100 | #309 | Tragic 29.6% |
| Cheyenne | 0.0 /100 | #310 | Tragic 29.4% |
| Choctaw | 0.0 /100 | #311 | Tragic 29.4% |
| Seminole | 0.0 /100 | #312 | Tragic 29.4% |
| Alaska Natives | 0.0 /100 | #313 | Tragic 29.4% |
| Shoshone | 0.0 /100 | #314 | Tragic 29.3% |
| Immigrants | Cabo Verde | 0.0 /100 | #315 | Tragic 29.2% |
| Sioux | 0.0 /100 | #316 | Tragic 29.1% |
Demographics Similar to Guamanians/Chamorros by Bachelor's Degree
In terms of bachelor's degree, the demographic groups most similar to Guamanians/Chamorros are Immigrants from West Indies (34.6%, a difference of 0.090%), Liberian (34.6%, a difference of 0.20%), Immigrants from Ecuador (34.7%, a difference of 0.22%), Tlingit-Haida (34.6%, a difference of 0.24%), and Hmong (34.8%, a difference of 0.32%).
| Demographics | Rating | Rank | Bachelor's Degree |
| Ecuadorians | 6.6 /100 | #227 | Tragic 35.4% |
| Immigrants | Trinidad and Tobago | 6.0 /100 | #228 | Tragic 35.3% |
| Whites/Caucasians | 5.9 /100 | #229 | Tragic 35.3% |
| Immigrants | Grenada | 4.3 /100 | #230 | Tragic 35.0% |
| Immigrants | St. Vincent and the Grenadines | 4.3 /100 | #231 | Tragic 35.0% |
| Hmong | 3.4 /100 | #232 | Tragic 34.8% |
| Immigrants | Ecuador | 3.3 /100 | #233 | Tragic 34.7% |
| Guamanians/Chamorros | 3.0 /100 | #234 | Tragic 34.6% |
| Immigrants | West Indies | 2.9 /100 | #235 | Tragic 34.6% |
| Liberians | 2.8 /100 | #236 | Tragic 34.6% |
| Tlingit-Haida | 2.8 /100 | #237 | Tragic 34.6% |
| Guyanese | 2.5 /100 | #238 | Tragic 34.5% |
| British West Indians | 2.5 /100 | #239 | Tragic 34.5% |
| Tongans | 2.0 /100 | #240 | Tragic 34.3% |
| Immigrants | Cambodia | 1.9 /100 | #241 | Tragic 34.2% |