Northern European vs Lebanese Bachelor's Degree
COMPARE
Northern European
Lebanese
Bachelor's Degree
Bachelor's Degree Comparison
Northern Europeans
Lebanese
41.0%
BACHELOR'S DEGREE
96.8/ 100
METRIC RATING
107th/ 347
METRIC RANK
40.4%
BACHELOR'S DEGREE
94.3/ 100
METRIC RATING
123rd/ 347
METRIC RANK
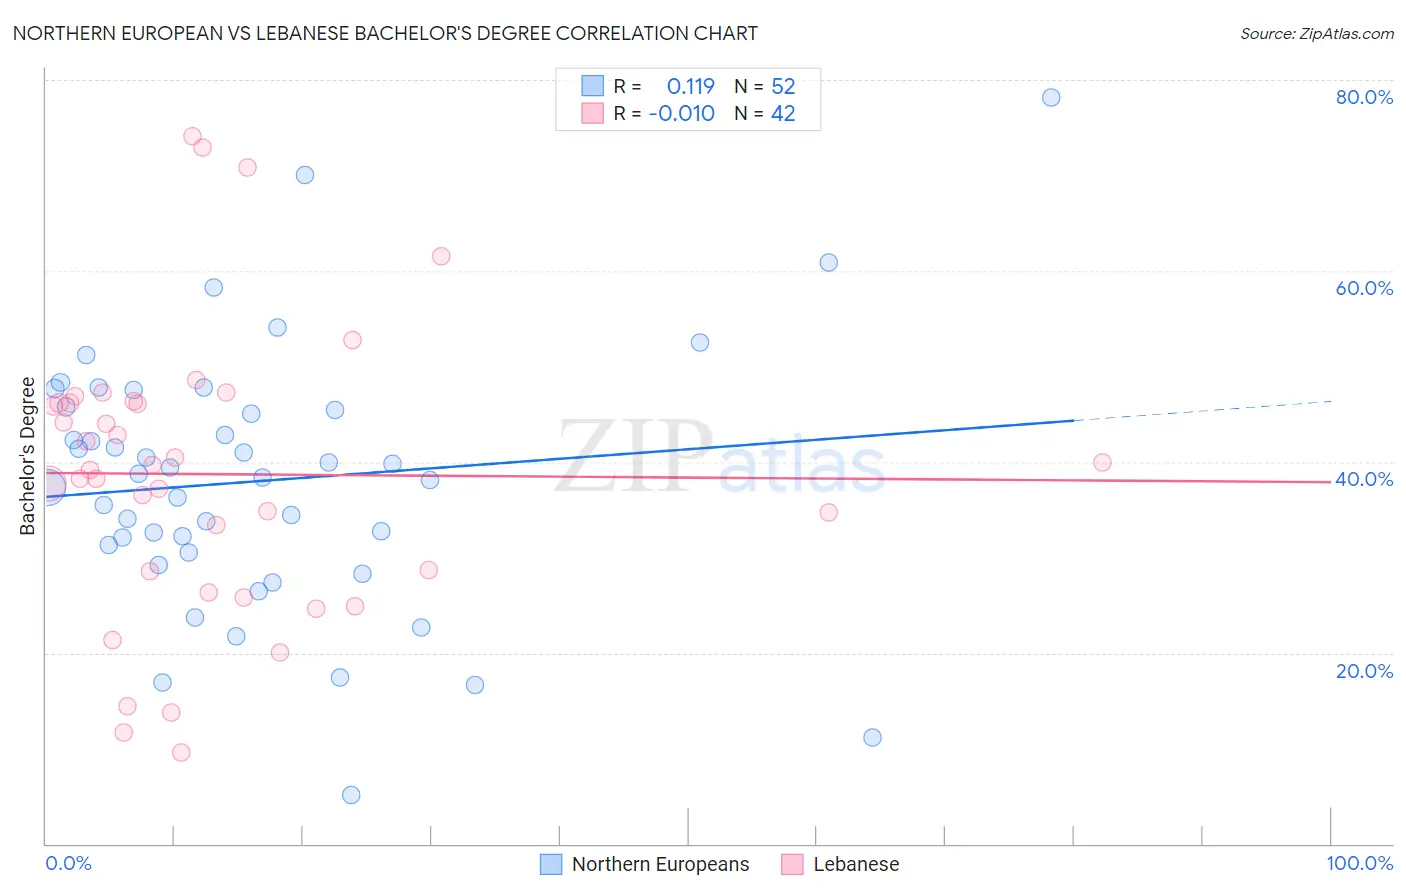
Northern European vs Lebanese Bachelor's Degree Correlation Chart
The statistical analysis conducted on geographies consisting of 406,072,770 people shows a poor positive correlation between the proportion of Northern Europeans and percentage of population with at least bachelor's degree education in the United States with a correlation coefficient (R) of 0.119 and weighted average of 41.0%. Similarly, the statistical analysis conducted on geographies consisting of 401,587,457 people shows no correlation between the proportion of Lebanese and percentage of population with at least bachelor's degree education in the United States with a correlation coefficient (R) of -0.010 and weighted average of 40.4%, a difference of 1.4%.
Bachelor's Degree Correlation Summary
| Measurement | Northern European | Lebanese |
| Minimum | 5.1% | 9.6% |
| Maximum | 78.2% | 74.0% |
| Range | 73.1% | 64.5% |
| Mean | 38.0% | 38.7% |
| Median | 38.6% | 39.4% |
| Interquartile 25% (IQ1) | 30.9% | 28.6% |
| Interquartile 75% (IQ3) | 45.6% | 46.2% |
| Interquartile Range (IQR) | 14.7% | 17.6% |
| Standard Deviation (Sample) | 13.7% | 15.0% |
| Standard Deviation (Population) | 13.5% | 14.9% |
Demographics Similar to Northern Europeans and Lebanese by Bachelor's Degree
In terms of bachelor's degree, the demographic groups most similar to Northern Europeans are Ukrainian (40.9%, a difference of 0.14%), Arab (40.9%, a difference of 0.16%), Alsatian (41.0%, a difference of 0.17%), Albanian (40.9%, a difference of 0.24%), and Immigrants from Chile (40.8%, a difference of 0.28%). Similarly, the demographic groups most similar to Lebanese are Immigrants from Eritrea (40.4%, a difference of 0.0%), Immigrants from Albania (40.4%, a difference of 0.020%), British (40.4%, a difference of 0.040%), Moroccan (40.5%, a difference of 0.12%), and Venezuelan (40.5%, a difference of 0.17%).
| Demographics | Rating | Rank | Bachelor's Degree |
| Syrians | 97.4 /100 | #105 | Exceptional 41.1% |
| Alsatians | 97.0 /100 | #106 | Exceptional 41.0% |
| Northern Europeans | 96.8 /100 | #107 | Exceptional 41.0% |
| Ukrainians | 96.6 /100 | #108 | Exceptional 40.9% |
| Arabs | 96.6 /100 | #109 | Exceptional 40.9% |
| Albanians | 96.5 /100 | #110 | Exceptional 40.9% |
| Immigrants | Chile | 96.4 /100 | #111 | Exceptional 40.8% |
| Ugandans | 96.3 /100 | #112 | Exceptional 40.8% |
| Brazilians | 96.3 /100 | #113 | Exceptional 40.8% |
| Afghans | 96.2 /100 | #114 | Exceptional 40.8% |
| Palestinians | 95.8 /100 | #115 | Exceptional 40.7% |
| Immigrants | Uganda | 95.7 /100 | #116 | Exceptional 40.7% |
| Austrians | 95.5 /100 | #117 | Exceptional 40.6% |
| Croatians | 95.5 /100 | #118 | Exceptional 40.6% |
| Immigrants | Syria | 94.9 /100 | #119 | Exceptional 40.5% |
| Venezuelans | 94.7 /100 | #120 | Exceptional 40.5% |
| Moroccans | 94.6 /100 | #121 | Exceptional 40.5% |
| Immigrants | Albania | 94.4 /100 | #122 | Exceptional 40.4% |
| Lebanese | 94.3 /100 | #123 | Exceptional 40.4% |
| Immigrants | Eritrea | 94.3 /100 | #124 | Exceptional 40.4% |
| British | 94.2 /100 | #125 | Exceptional 40.4% |