Hispanic or Latino vs Guamanian/Chamorro Unemployment Among Seniors over 75 years
COMPARE
Hispanic or Latino
Guamanian/Chamorro
Unemployment Among Seniors over 75 years
Unemployment Among Seniors over 75 years Comparison
Hispanics or Latinos
Guamanians/Chamorros
9.1%
UNEMPLOYMENT AMONG SENIORS OVER 75 YEARS
5.0/ 100
METRIC RATING
229th/ 347
METRIC RANK
9.0%
UNEMPLOYMENT AMONG SENIORS OVER 75 YEARS
7.7/ 100
METRIC RATING
221st/ 347
METRIC RANK
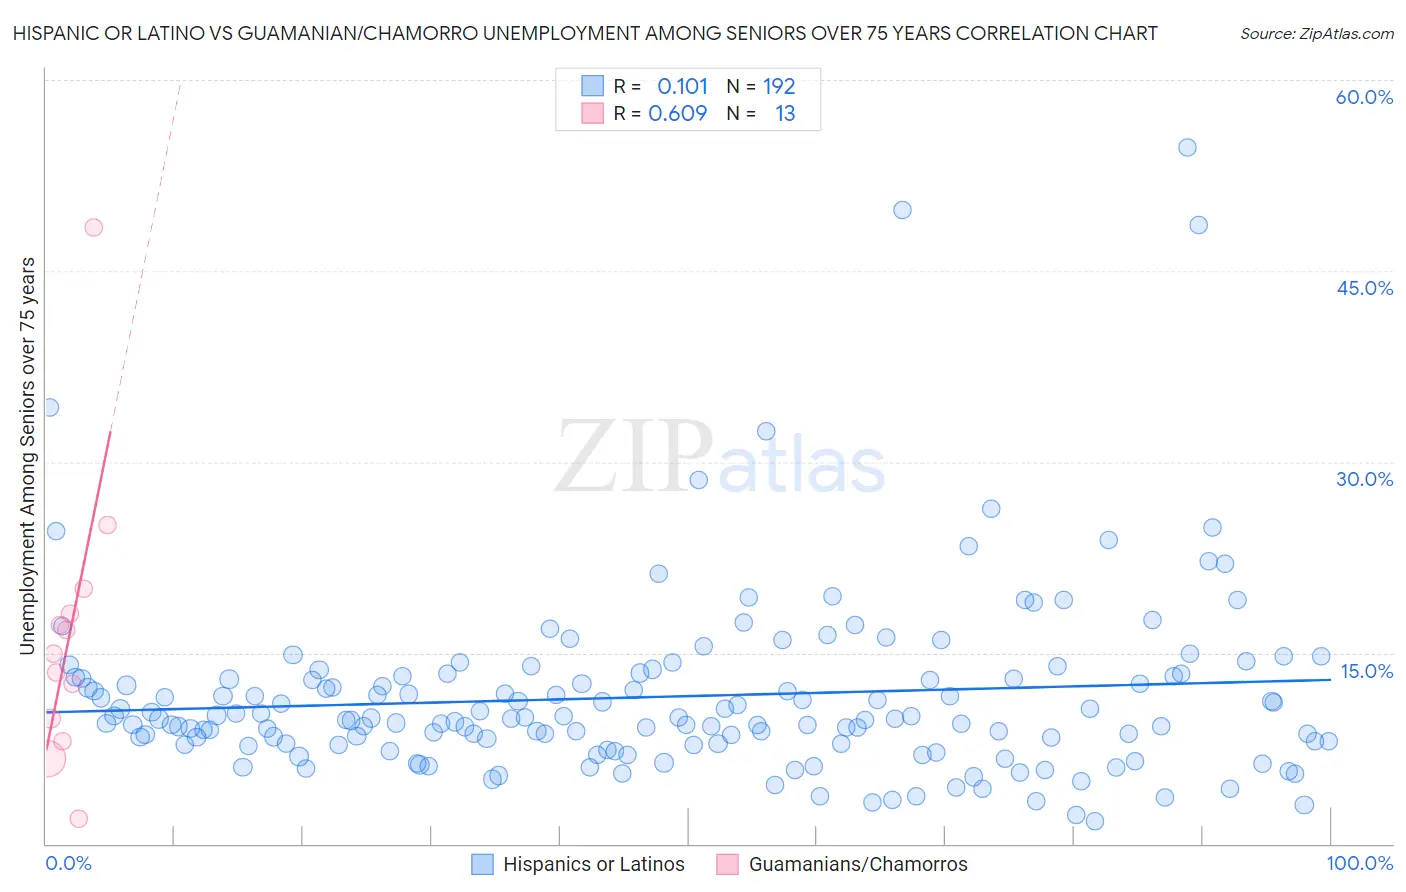
Hispanic or Latino vs Guamanian/Chamorro Unemployment Among Seniors over 75 years Correlation Chart
The statistical analysis conducted on geographies consisting of 235,499,267 people shows a poor positive correlation between the proportion of Hispanics or Latinos and unemployment rate among seniors over the age of 75 in the United States with a correlation coefficient (R) of 0.101 and weighted average of 9.1%. Similarly, the statistical analysis conducted on geographies consisting of 136,667,243 people shows a significant positive correlation between the proportion of Guamanians/Chamorros and unemployment rate among seniors over the age of 75 in the United States with a correlation coefficient (R) of 0.609 and weighted average of 9.0%, a difference of 0.60%.
Unemployment Among Seniors over 75 years Correlation Summary
| Measurement | Hispanic or Latino | Guamanian/Chamorro |
| Minimum | 1.8% | 2.0% |
| Maximum | 54.7% | 48.4% |
| Range | 52.9% | 46.4% |
| Mean | 11.6% | 16.4% |
| Median | 9.8% | 14.9% |
| Interquartile 25% (IQ1) | 7.8% | 8.9% |
| Interquartile 75% (IQ3) | 13.1% | 19.0% |
| Interquartile Range (IQR) | 5.3% | 10.1% |
| Standard Deviation (Sample) | 7.2% | 11.4% |
| Standard Deviation (Population) | 7.2% | 10.9% |
Demographics Similar to Hispanics or Latinos and Guamanians/Chamorros by Unemployment Among Seniors over 75 years
In terms of unemployment among seniors over 75 years, the demographic groups most similar to Hispanics or Latinos are Northern European (9.1%, a difference of 0.010%), Immigrants from Central America (9.1%, a difference of 0.010%), African (9.1%, a difference of 0.030%), Yugoslavian (9.1%, a difference of 0.050%), and Vietnamese (9.1%, a difference of 0.10%). Similarly, the demographic groups most similar to Guamanians/Chamorros are Immigrants from Zimbabwe (9.0%, a difference of 0.020%), Peruvian (9.0%, a difference of 0.070%), Afghan (9.0%, a difference of 0.10%), Immigrants from Jordan (9.0%, a difference of 0.14%), and Costa Rican (9.1%, a difference of 0.27%).
| Demographics | Rating | Rank | Unemployment Among Seniors over 75 years |
| Immigrants | Western Asia | 12.5 /100 | #215 | Poor 9.0% |
| Immigrants | Oceania | 11.8 /100 | #216 | Poor 9.0% |
| Lebanese | 11.1 /100 | #217 | Poor 9.0% |
| Immigrants | Africa | 9.7 /100 | #218 | Tragic 9.0% |
| Afghans | 8.3 /100 | #219 | Tragic 9.0% |
| Immigrants | Zimbabwe | 7.8 /100 | #220 | Tragic 9.0% |
| Guamanians/Chamorros | 7.7 /100 | #221 | Tragic 9.0% |
| Peruvians | 7.3 /100 | #222 | Tragic 9.0% |
| Immigrants | Jordan | 6.9 /100 | #223 | Tragic 9.0% |
| Costa Ricans | 6.3 /100 | #224 | Tragic 9.1% |
| Navajo | 6.1 /100 | #225 | Tragic 9.1% |
| Immigrants | Bangladesh | 5.9 /100 | #226 | Tragic 9.1% |
| Samoans | 5.7 /100 | #227 | Tragic 9.1% |
| Kenyans | 5.4 /100 | #228 | Tragic 9.1% |
| Hispanics or Latinos | 5.0 /100 | #229 | Tragic 9.1% |
| Northern Europeans | 4.9 /100 | #230 | Tragic 9.1% |
| Immigrants | Central America | 4.9 /100 | #231 | Tragic 9.1% |
| Africans | 4.9 /100 | #232 | Tragic 9.1% |
| Yugoslavians | 4.8 /100 | #233 | Tragic 9.1% |
| Vietnamese | 4.6 /100 | #234 | Tragic 9.1% |
| Panamanians | 4.0 /100 | #235 | Tragic 9.1% |