Immigrants from Serbia vs Guamanian/Chamorro Bachelor's Degree
COMPARE
Immigrants from Serbia
Guamanian/Chamorro
Bachelor's Degree
Bachelor's Degree Comparison
Immigrants from Serbia
Guamanians/Chamorros
44.1%
BACHELOR'S DEGREE
99.9/ 100
METRIC RATING
56th/ 347
METRIC RANK
34.6%
BACHELOR'S DEGREE
3.0/ 100
METRIC RATING
234th/ 347
METRIC RANK
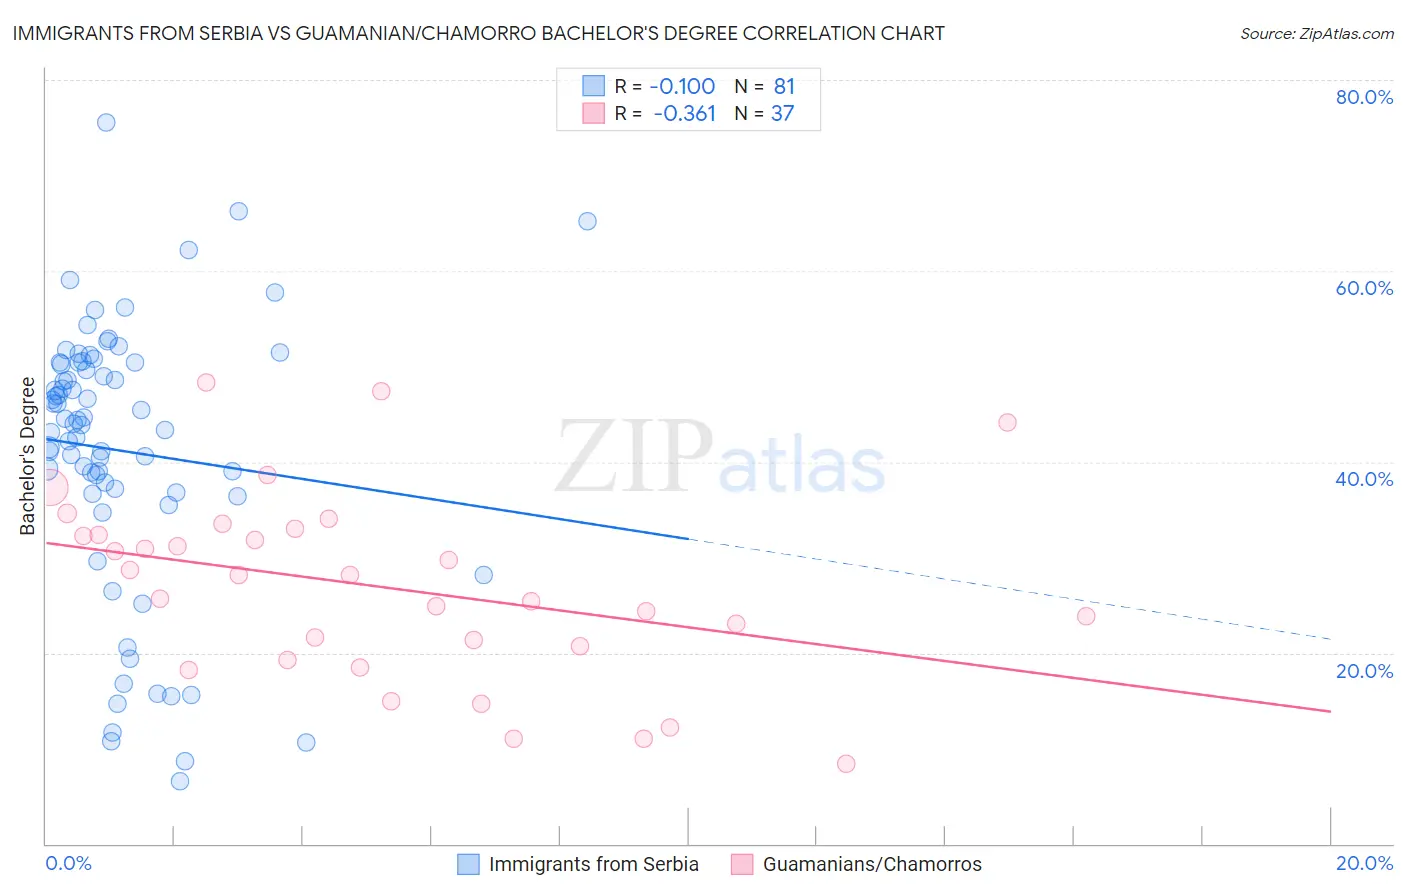
Immigrants from Serbia vs Guamanian/Chamorro Bachelor's Degree Correlation Chart
The statistical analysis conducted on geographies consisting of 131,744,029 people shows a poor negative correlation between the proportion of Immigrants from Serbia and percentage of population with at least bachelor's degree education in the United States with a correlation coefficient (R) of -0.100 and weighted average of 44.1%. Similarly, the statistical analysis conducted on geographies consisting of 221,963,631 people shows a mild negative correlation between the proportion of Guamanians/Chamorros and percentage of population with at least bachelor's degree education in the United States with a correlation coefficient (R) of -0.361 and weighted average of 34.6%, a difference of 27.4%.
Bachelor's Degree Correlation Summary
| Measurement | Immigrants from Serbia | Guamanian/Chamorro |
| Minimum | 6.6% | 8.3% |
| Maximum | 75.5% | 48.4% |
| Range | 69.0% | 40.0% |
| Mean | 41.1% | 26.9% |
| Median | 44.0% | 28.2% |
| Interquartile 25% (IQ1) | 36.7% | 20.0% |
| Interquartile 75% (IQ3) | 50.4% | 32.6% |
| Interquartile Range (IQR) | 13.6% | 12.7% |
| Standard Deviation (Sample) | 14.2% | 9.8% |
| Standard Deviation (Population) | 14.1% | 9.7% |
Similar Demographics by Bachelor's Degree
Demographics Similar to Immigrants from Serbia by Bachelor's Degree
In terms of bachelor's degree, the demographic groups most similar to Immigrants from Serbia are Immigrants from Bolivia (44.2%, a difference of 0.18%), Immigrants from Austria (44.2%, a difference of 0.19%), Paraguayan (44.0%, a difference of 0.19%), Immigrants from Czechoslovakia (44.0%, a difference of 0.24%), and Australian (44.0%, a difference of 0.34%).
| Demographics | Rating | Rank | Bachelor's Degree |
| Immigrants | Norway | 99.9 /100 | #49 | Exceptional 44.5% |
| Immigrants | Greece | 99.9 /100 | #50 | Exceptional 44.5% |
| Asians | 99.9 /100 | #51 | Exceptional 44.4% |
| Immigrants | Spain | 99.9 /100 | #52 | Exceptional 44.3% |
| Immigrants | Asia | 99.9 /100 | #53 | Exceptional 44.3% |
| Immigrants | Austria | 99.9 /100 | #54 | Exceptional 44.2% |
| Immigrants | Bolivia | 99.9 /100 | #55 | Exceptional 44.2% |
| Immigrants | Serbia | 99.9 /100 | #56 | Exceptional 44.1% |
| Paraguayans | 99.9 /100 | #57 | Exceptional 44.0% |
| Immigrants | Czechoslovakia | 99.9 /100 | #58 | Exceptional 44.0% |
| Australians | 99.9 /100 | #59 | Exceptional 44.0% |
| New Zealanders | 99.9 /100 | #60 | Exceptional 44.0% |
| South Africans | 99.8 /100 | #61 | Exceptional 43.6% |
| Immigrants | Kazakhstan | 99.8 /100 | #62 | Exceptional 43.4% |
| Immigrants | Europe | 99.8 /100 | #63 | Exceptional 43.4% |
Demographics Similar to Guamanians/Chamorros by Bachelor's Degree
In terms of bachelor's degree, the demographic groups most similar to Guamanians/Chamorros are Immigrants from West Indies (34.6%, a difference of 0.090%), Liberian (34.6%, a difference of 0.20%), Immigrants from Ecuador (34.7%, a difference of 0.22%), Tlingit-Haida (34.6%, a difference of 0.24%), and Hmong (34.8%, a difference of 0.32%).
| Demographics | Rating | Rank | Bachelor's Degree |
| Ecuadorians | 6.6 /100 | #227 | Tragic 35.4% |
| Immigrants | Trinidad and Tobago | 6.0 /100 | #228 | Tragic 35.3% |
| Whites/Caucasians | 5.9 /100 | #229 | Tragic 35.3% |
| Immigrants | Grenada | 4.3 /100 | #230 | Tragic 35.0% |
| Immigrants | St. Vincent and the Grenadines | 4.3 /100 | #231 | Tragic 35.0% |
| Hmong | 3.4 /100 | #232 | Tragic 34.8% |
| Immigrants | Ecuador | 3.3 /100 | #233 | Tragic 34.7% |
| Guamanians/Chamorros | 3.0 /100 | #234 | Tragic 34.6% |
| Immigrants | West Indies | 2.9 /100 | #235 | Tragic 34.6% |
| Liberians | 2.8 /100 | #236 | Tragic 34.6% |
| Tlingit-Haida | 2.8 /100 | #237 | Tragic 34.6% |
| Guyanese | 2.5 /100 | #238 | Tragic 34.5% |
| British West Indians | 2.5 /100 | #239 | Tragic 34.5% |
| Tongans | 2.0 /100 | #240 | Tragic 34.3% |
| Immigrants | Cambodia | 1.9 /100 | #241 | Tragic 34.2% |