Hawaiian vs Immigrants from Grenada 6th Grade
COMPARE
Hawaiian
Immigrants from Grenada
6th Grade
6th Grade Comparison
Hawaiians
Immigrants from Grenada
96.9%
6TH GRADE
27.0/ 100
METRIC RATING
192nd/ 347
METRIC RANK
95.9%
6TH GRADE
0.0/ 100
METRIC RATING
295th/ 347
METRIC RANK
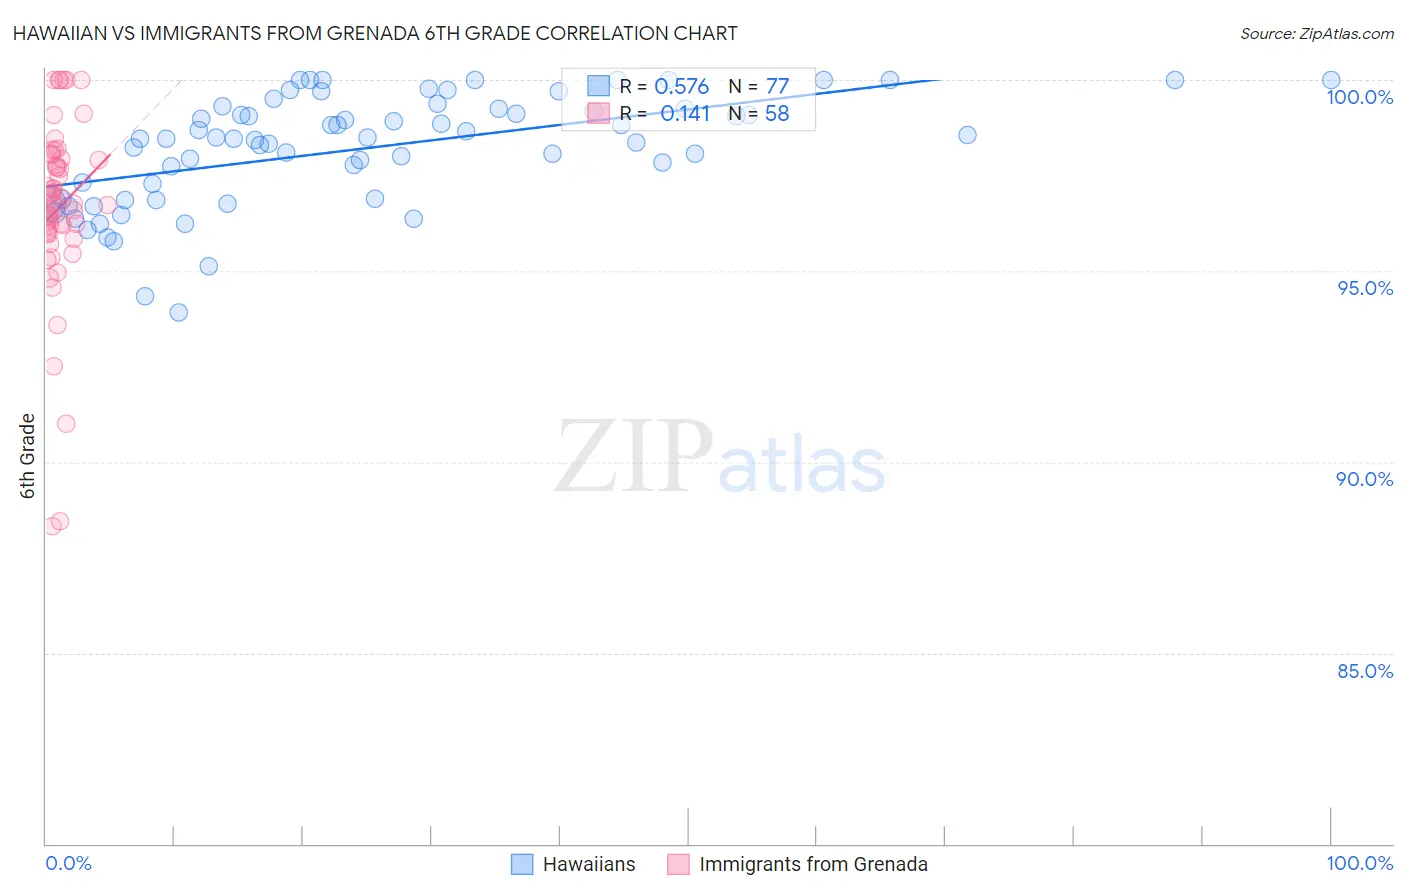
Hawaiian vs Immigrants from Grenada 6th Grade Correlation Chart
The statistical analysis conducted on geographies consisting of 327,621,279 people shows a substantial positive correlation between the proportion of Hawaiians and percentage of population with at least 6th grade education in the United States with a correlation coefficient (R) of 0.576 and weighted average of 96.9%. Similarly, the statistical analysis conducted on geographies consisting of 67,201,142 people shows a poor positive correlation between the proportion of Immigrants from Grenada and percentage of population with at least 6th grade education in the United States with a correlation coefficient (R) of 0.141 and weighted average of 95.9%, a difference of 1.0%.
6th Grade Correlation Summary
| Measurement | Hawaiian | Immigrants from Grenada |
| Minimum | 93.9% | 88.3% |
| Maximum | 100.0% | 100.0% |
| Range | 6.1% | 11.7% |
| Mean | 98.2% | 96.6% |
| Median | 98.5% | 96.8% |
| Interquartile 25% (IQ1) | 96.9% | 96.0% |
| Interquartile 75% (IQ3) | 99.3% | 97.9% |
| Interquartile Range (IQR) | 2.4% | 2.0% |
| Standard Deviation (Sample) | 1.4% | 2.4% |
| Standard Deviation (Population) | 1.4% | 2.3% |
Similar Demographics by 6th Grade
Demographics Similar to Hawaiians by 6th Grade
In terms of 6th grade, the demographic groups most similar to Hawaiians are Panamanian (96.9%, a difference of 0.0%), Paraguayan (96.9%, a difference of 0.0%), Dutch West Indian (96.9%, a difference of 0.010%), Immigrants from Lebanon (96.9%, a difference of 0.010%), and Immigrants from Brazil (96.9%, a difference of 0.010%).
| Demographics | Rating | Rank | 6th Grade |
| Argentineans | 33.0 /100 | #185 | Fair 97.0% |
| Immigrants | Egypt | 31.4 /100 | #186 | Fair 97.0% |
| Guamanians/Chamorros | 30.6 /100 | #187 | Fair 97.0% |
| Immigrants | Argentina | 30.4 /100 | #188 | Fair 97.0% |
| Blacks/African Americans | 30.2 /100 | #189 | Fair 97.0% |
| Dutch West Indians | 28.3 /100 | #190 | Fair 96.9% |
| Panamanians | 27.3 /100 | #191 | Fair 96.9% |
| Hawaiians | 27.0 /100 | #192 | Fair 96.9% |
| Paraguayans | 26.6 /100 | #193 | Fair 96.9% |
| Immigrants | Lebanon | 25.6 /100 | #194 | Fair 96.9% |
| Immigrants | Brazil | 25.5 /100 | #195 | Fair 96.9% |
| Immigrants | Uganda | 21.2 /100 | #196 | Fair 96.9% |
| Brazilians | 20.1 /100 | #197 | Fair 96.9% |
| Immigrants | Albania | 18.8 /100 | #198 | Poor 96.9% |
| Immigrants | Northern Africa | 15.7 /100 | #199 | Poor 96.9% |
Demographics Similar to Immigrants from Grenada by 6th Grade
In terms of 6th grade, the demographic groups most similar to Immigrants from Grenada are Immigrants from South Eastern Asia (95.9%, a difference of 0.010%), British West Indian (96.0%, a difference of 0.070%), Haitian (95.8%, a difference of 0.12%), Immigrants from West Indies (96.1%, a difference of 0.13%), and Immigrants from Barbados (96.1%, a difference of 0.17%).
| Demographics | Rating | Rank | 6th Grade |
| Malaysians | 0.0 /100 | #288 | Tragic 96.2% |
| Immigrants | Eritrea | 0.0 /100 | #289 | Tragic 96.1% |
| Immigrants | Somalia | 0.0 /100 | #290 | Tragic 96.1% |
| Immigrants | St. Vincent and the Grenadines | 0.0 /100 | #291 | Tragic 96.1% |
| Immigrants | Barbados | 0.0 /100 | #292 | Tragic 96.1% |
| Immigrants | West Indies | 0.0 /100 | #293 | Tragic 96.1% |
| British West Indians | 0.0 /100 | #294 | Tragic 96.0% |
| Immigrants | Grenada | 0.0 /100 | #295 | Tragic 95.9% |
| Immigrants | South Eastern Asia | 0.0 /100 | #296 | Tragic 95.9% |
| Haitians | 0.0 /100 | #297 | Tragic 95.8% |
| Sri Lankans | 0.0 /100 | #298 | Tragic 95.8% |
| Immigrants | Laos | 0.0 /100 | #299 | Tragic 95.7% |
| Immigrants | Dominica | 0.0 /100 | #300 | Tragic 95.7% |
| Immigrants | Immigrants | 0.0 /100 | #301 | Tragic 95.7% |
| Immigrants | Burma/Myanmar | 0.0 /100 | #302 | Tragic 95.7% |