Hawaiian vs Iranian 6th Grade
COMPARE
Hawaiian
Iranian
6th Grade
6th Grade Comparison
Hawaiians
Iranians
96.9%
6TH GRADE
27.0/ 100
METRIC RATING
192nd/ 347
METRIC RANK
97.6%
6TH GRADE
99.6/ 100
METRIC RATING
69th/ 347
METRIC RANK
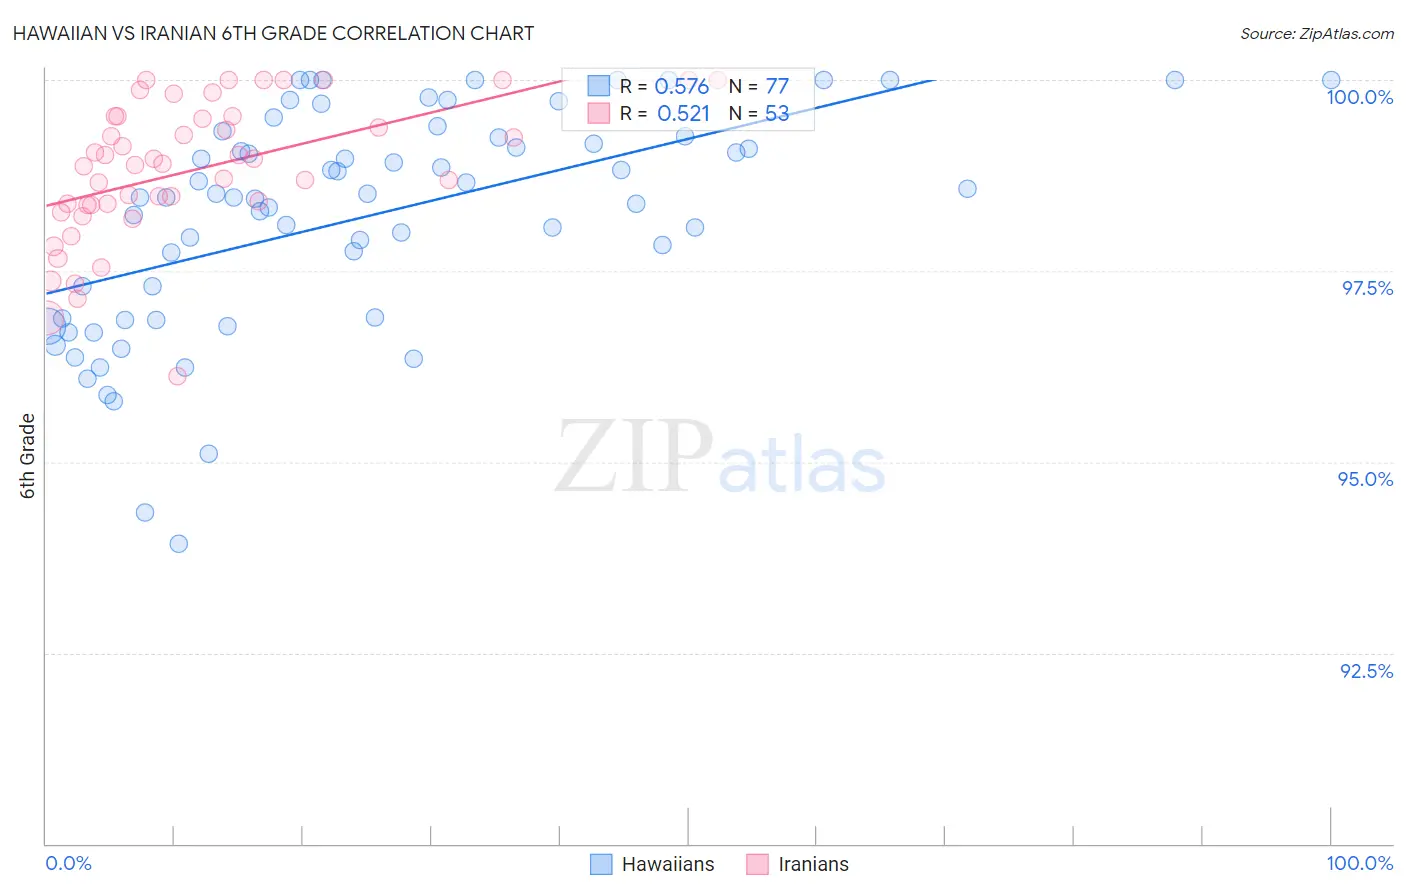
Hawaiian vs Iranian 6th Grade Correlation Chart
The statistical analysis conducted on geographies consisting of 327,621,279 people shows a substantial positive correlation between the proportion of Hawaiians and percentage of population with at least 6th grade education in the United States with a correlation coefficient (R) of 0.576 and weighted average of 96.9%. Similarly, the statistical analysis conducted on geographies consisting of 310,636,461 people shows a substantial positive correlation between the proportion of Iranians and percentage of population with at least 6th grade education in the United States with a correlation coefficient (R) of 0.521 and weighted average of 97.6%, a difference of 0.73%.
6th Grade Correlation Summary
| Measurement | Hawaiian | Iranian |
| Minimum | 93.9% | 96.1% |
| Maximum | 100.0% | 100.0% |
| Range | 6.1% | 3.9% |
| Mean | 98.2% | 98.8% |
| Median | 98.5% | 98.9% |
| Interquartile 25% (IQ1) | 96.9% | 98.4% |
| Interquartile 75% (IQ3) | 99.3% | 99.5% |
| Interquartile Range (IQR) | 2.4% | 1.2% |
| Standard Deviation (Sample) | 1.4% | 0.91% |
| Standard Deviation (Population) | 1.4% | 0.90% |
Similar Demographics by 6th Grade
Demographics Similar to Hawaiians by 6th Grade
In terms of 6th grade, the demographic groups most similar to Hawaiians are Panamanian (96.9%, a difference of 0.0%), Paraguayan (96.9%, a difference of 0.0%), Dutch West Indian (96.9%, a difference of 0.010%), Immigrants from Lebanon (96.9%, a difference of 0.010%), and Immigrants from Brazil (96.9%, a difference of 0.010%).
| Demographics | Rating | Rank | 6th Grade |
| Argentineans | 33.0 /100 | #185 | Fair 97.0% |
| Immigrants | Egypt | 31.4 /100 | #186 | Fair 97.0% |
| Guamanians/Chamorros | 30.6 /100 | #187 | Fair 97.0% |
| Immigrants | Argentina | 30.4 /100 | #188 | Fair 97.0% |
| Blacks/African Americans | 30.2 /100 | #189 | Fair 97.0% |
| Dutch West Indians | 28.3 /100 | #190 | Fair 96.9% |
| Panamanians | 27.3 /100 | #191 | Fair 96.9% |
| Hawaiians | 27.0 /100 | #192 | Fair 96.9% |
| Paraguayans | 26.6 /100 | #193 | Fair 96.9% |
| Immigrants | Lebanon | 25.6 /100 | #194 | Fair 96.9% |
| Immigrants | Brazil | 25.5 /100 | #195 | Fair 96.9% |
| Immigrants | Uganda | 21.2 /100 | #196 | Fair 96.9% |
| Brazilians | 20.1 /100 | #197 | Fair 96.9% |
| Immigrants | Albania | 18.8 /100 | #198 | Poor 96.9% |
| Immigrants | Northern Africa | 15.7 /100 | #199 | Poor 96.9% |
Demographics Similar to Iranians by 6th Grade
In terms of 6th grade, the demographic groups most similar to Iranians are Cajun (97.6%, a difference of 0.010%), New Zealander (97.7%, a difference of 0.020%), Kiowa (97.7%, a difference of 0.020%), Immigrants from Austria (97.7%, a difference of 0.020%), and Chickasaw (97.6%, a difference of 0.020%).
| Demographics | Rating | Rank | 6th Grade |
| Immigrants | North America | 99.7 /100 | #62 | Exceptional 97.7% |
| Russians | 99.7 /100 | #63 | Exceptional 97.7% |
| Canadians | 99.7 /100 | #64 | Exceptional 97.7% |
| Immigrants | Northern Europe | 99.6 /100 | #65 | Exceptional 97.7% |
| New Zealanders | 99.6 /100 | #66 | Exceptional 97.7% |
| Kiowa | 99.6 /100 | #67 | Exceptional 97.7% |
| Immigrants | Austria | 99.6 /100 | #68 | Exceptional 97.7% |
| Iranians | 99.6 /100 | #69 | Exceptional 97.6% |
| Cajuns | 99.5 /100 | #70 | Exceptional 97.6% |
| Chickasaw | 99.5 /100 | #71 | Exceptional 97.6% |
| Macedonians | 99.4 /100 | #72 | Exceptional 97.6% |
| Cherokee | 99.4 /100 | #73 | Exceptional 97.6% |
| Immigrants | Netherlands | 99.4 /100 | #74 | Exceptional 97.6% |
| Ukrainians | 99.4 /100 | #75 | Exceptional 97.6% |
| Immigrants | England | 99.4 /100 | #76 | Exceptional 97.6% |